
Fig. 5
- ID
- ZDB-FIG-180105-14
- Publication
- Lee et al., 2017 - The Kinesin Adaptor Calsyntenin-1 Organizes Microtubule Polarity and Regulates Dynamics during Sensory Axon Arbor Development
- Other Figures
- All Figure Page
- Back to All Figure Page
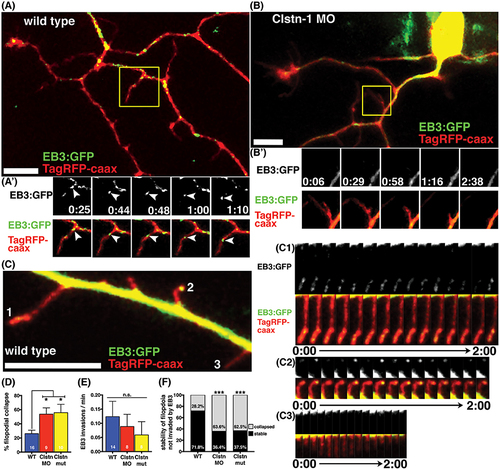
Clstn-1 is required for stability of filopodia along peripheral axon shafts. (A) Neuron in wild type embryo labeled with TagRFP-caax and EB3-GFP. Stable filopodia structures are often invaded by MTs as seen in the time-lapse sequence in (A'). Time is in min:sec. Scale bar is 10 μm in this and all other neuron images. (B) Neuron in Clstn-1 MO embryo showing collapse of a filopidum in time-lapse sequence in (B'). Filopodia in Clstn-1 lof more frequently collapse, as shown in Clstn-1 MO neuron. Collapsing filopodia usually do not have invading EB3 comets as shown in this montage. (C) Segment of peripheral axon labeled with TagRFP-caax and EB3-GFP. EB3-GFP signal brightness is increased to show fainter signal in filopodia. Filopodia labeled 1, 2, and 3 are shown in time-lapse in (C1–C3). Time-lapse sequences showing stable filopodia containing static EB3-GFP accumulations at their distal tips over several minutes in (C1,C2), while collapsing filopodia have no EB3 accumulations, as seen in C3. (D) A greater percentage of filopodia collapse in Clstn-1 lof than in wild type (WT collapse = 26.11% in n = 16 neurons, Clstn-1 MO collapse = 53.62% in n = 9 neurons, *p = 0.039 Dunnett's post-test, Clstn-1−/− collapse = 55.83% in n = 10 neurons, *p = 0.020 Dunnett's post-test, *p = 0.0145 one-way ANOVA). (E) There is no significant difference in the rate of EB3-GFP invasions into filopodia between wild type and Clstn-1 lof (mean WT rate = 0.124 comets/min, n = 14 neurons; mean Clstn-1 MO rate = 0.0885 comets/min, n = 8 neurons; mean Clstn-1−/− rate = 0.0724 comets/min, n = 8 neurons; p = 0.068 one-way ANOVA). (F) Percentages of filopodia not invaded by MTs that collapse or remain stable during a 3-min period. (WT = 28.2%, n = 71 filopodia; Clstn-1 MO = 63.6%, n = 33 filopodia, ***p = 0.0003 chi-squared test; Clstn-1−/− = 52.5%, n = 40 filopodia, ***p = 0.0002 chi-squared test). |
| Fish: | |
|---|---|
| Knockdown Reagent: | |
| Observed In: | |
| Stage Range: | 14-19 somites to Prim-5 |