
Fig. 7
- ID
- ZDB-FIG-171227-51
- Publication
- Shi et al., 2014 - tRNA synthetase counteracts c-Myc to develop functional vasculature
- Other Figures
- All Figure Page
- Back to All Figure Page
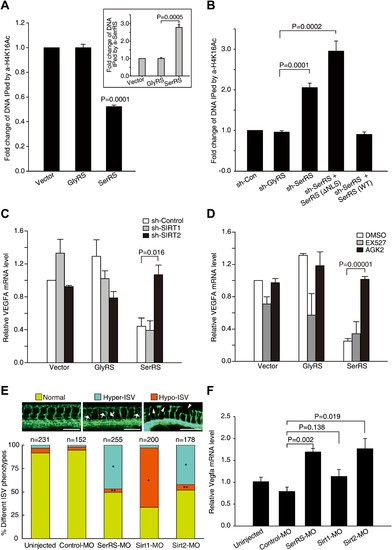
SerRS recruits SIRT2 to epigenetically silence VEGFA expression. (A) ChIP assay to show that overexpression of SerRS reduces histone H4 acetylation level on the VEGFA promoter. HEK 293 cells were transfected with plasmids expressing SerRS, GlyRS or empty vector. The cell lysates were subjected to local ChIP analysis using anti-H4K16Ac (acetylated H4 at K16), anti-H4 (total), or anti-SerRS antibodies and a primer set targeting the VEGFA promoter. The amounts of DNA immunoprecipitated by anti-H4K16Ac antibody were normalized to those by anti-H4 antibody prior to fold change calculation. Inset: the normalized amounts of DNA immunoprecipitated by anti-SerRS. All data were shown as means ± SEM (n = 3). (B) ChIP assay to show that knock down of SerRS expression or exclusion of SerRS from the nucleus increases histone H4 acetylation level on the VEGFA promoter. HEK 293 cells were transfected with plasmids expressing the indicated molecules and subjected to local ChIP analysis as described above. As a control, GlyRS expression was knocked down but had no effect on H4 acetylation. (C) Effect of SIRT2 expression on the transcriptional repressor activity of SerRS as measured by VEGFA expression. HEK 293 cells were co-transfected with plasmids expressing shRNAs targeting SIRT1, SIRT2 or control shRNA and plasmids expressing SerRS, GlyRS or empty vector for 36 hr. The VEGFA expression levels were determined by using real-time RT-qPCR and are shown as means ± SEM (n = 3). (D) Effect of SIRT2-specific inhibitor on the transcriptional repressor activity of SerRS as measured by VEGFA expression. HEK 293 cells were transfected with plasmids expressing SerRS, GlyRS or empty vector. SIRT2-specific inhibitor AGK2 (10 µM, final concentration) or SIRT1-specific inhibitor EX-527 (1 µm, final concentration) or solvent alone (DMSO) was added to the cell culture media 2 hr post-transfection. VEGFA expression levels were measured 24 hr post-transfection by using real-time RT-qPCR and are shown as means ± SEM (n = 3). (E) Functional correlation between SerRS and SIRT2 in zebrafish. The percentage of Tg(Fli1a:EGFP) zebrafish embryos showing different ISV phenotypes at 3 days post fertilization after the injection of morpholinos targeting SerRS (SerRS-MO), Sirt1 (Sirt1-MO), Sirt2 (Sirt2-MO), or a control morpholino (Control-MO) are illustrated. Scale bars represent 0.25 mm. *p<0.0001 vs Control-MO, **p>0.1 vs Control-MO. (F) The effects of knocking down SerRS, Sirt2, or Sirt1 in zebrafish on Vegfa expression were examined by real-time RT-qPCR at 1 day post fertilization after injection of morpholinos as indicated. Data are shown as means ± SEM (n = 10–15). |
| Gene: | |
|---|---|
| Fish: | |
| Knockdown Reagents: | |
| Anatomical Term: | |
| Stage: | Prim-5 |
| Fish: | |
|---|---|
| Knockdown Reagents: | |
| Observed In: | |
| Stage Range: | Prim-5 to Protruding-mouth |