
Fig. 7
- ID
- ZDB-FIG-171208-9
- Publication
- Goodhill et al., 2015 - The dynamics of growth cone morphology
- Other Figures
- All Figure Page
- Back to All Figure Page
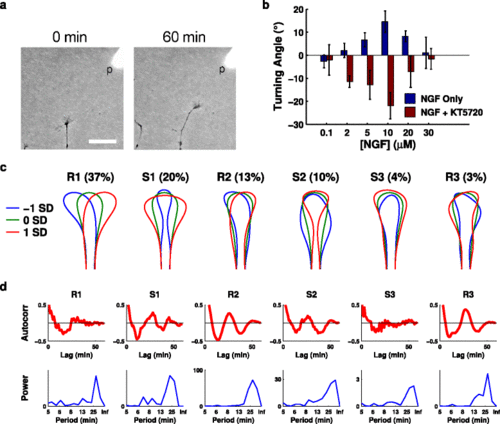
Similar modes and oscillations are seen during chemotaxis. (a) Example of growth cone moving in response to gradient produced from a pipette (p). Scale bar: 40 µm. (b) Chemotactic sensitivity curves (final turning angle after 60 min of growth) for both attractive and repulsive conditions. (c) Significant modes for pipette assay movies. The two M (mixed) modes from Figure 1c have now separated more clearly into R (reflective) and S (symmetric) modes, but otherwise the mode shapes, and their variance explained, are very similar to the in vitro (no gradient) dataset. (d) Oscillations in a representative pipette movie. NGF, nerve growth factor; SD, standard deviation. |