Fig. 9
- ID
- ZDB-FIG-171208-10
- Publication
- Goodhill et al., 2015 - The dynamics of growth cone morphology
- Other Figures
- All Figure Page
- Back to All Figure Page
|
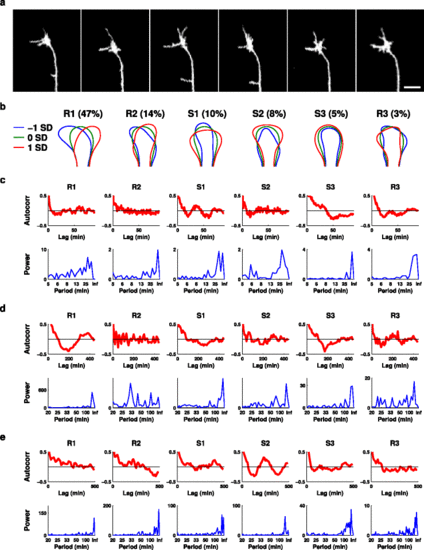
Similar mode shapes and oscillations are also present in vivo . (a) Typical sequence of frames 10 min apart from a time-lapse movie of a zebrafish retinal ganglion cell growth cone navigating across the tectum in vivo. Scale bar: 10 µm. (b) The significant shape modes derived from this dataset. (c,d,e) Mode oscillations for a 2 h movie with frames every 1 min (c), and 20 h movies with frames every 10 min (d,e). In the former case oscillations of similar period to those observed in vitro are seen, while in the latter cases oscillations with longer periods become apparent. Autocorr, autocorrelation; SD, standard deviation. |

