
Fig. 1
- ID
- ZDB-FIG-171206-69
- Publication
- Sheets, 2017 - Excessive activation of ionotropic glutamate receptors induces apoptotic hair-cell death independent of afferent and efferent innervation
- Other Figures
- All Figure Page
- Back to All Figure Page
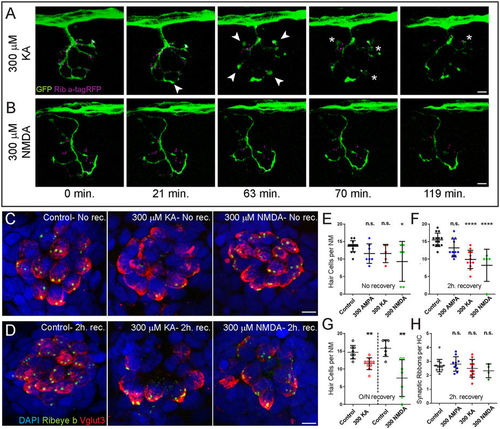
Exposure to KA or NMDA initiates hair-cell loss, but not synaptic-ribbon loss. (A,B) Live-imaging of KA (A) or NMDA (B) exposure: Representative frames from a movie taken over 2 hours with one frame per 3.5 minutes. Each frame is a maximum intensity projection (z-stack top-down image) of posterior lateral-line (LL) NM3 in a 6 dpf transgenic larva expressing Ribeye a-tagRFP in hair cells and GFP in afferent nerve fibers. Arrowheads in (A) indicate afferent-terminal swellings; asterisks indicate bursting afferent terminals. (C,D) Representative maximum intensity top-down (x-y) projections of imunolabeled Vglut3 (red) labeling the basolateral-end of hair cells and Ribeye b (green) labeling synaptic ribbons in NM3 of 6 dpf larvae. Larvae were exposed to DMSO carrier alone (Control) or iGluR agonists for 1 hour, then either immediately fixed ((C); No rec.) or rinsed and allowed to recover for 2 hours ((D); 2 h. rec.). Hair-cell death was confirmed by absence of DAPI-labeled nuclei. Scale bars: 3 μm (E–H) The number of intact hair cells per NM (E–G) or number of synaptic ribbons per hair cell (H) in 6 dpf (E,F,H) or 7 dpf (G) larvae exposed to DMSO alone or 300 μM iGluR agonist. Each circle represents NM3 in an individual larva. There was no significant loss of hair cells in NMs following exposure to AMPA at any time-point or the more excitotoxic AMPA/Kainate receptor agonist KA immediately following exposure (E). However, there were significantly fewer hair cells per NM in KA and NMDA-treated larvae compared to control 2 hours after drug exposure (F; ****p < 0.0001 defined by Dunnett’s multiple comparisons test) and after 20–22 h. recovery post-exposure (G, **p < 0.01 defined by unpaired t test). There was no significant difference in the number of synaptic ribbons per hair cell 2 h. after drug exposure (H), defined by Dunnett’s multiple comparisons test). |
| Genes: | |
|---|---|
| Antibodies: | |
| Fish: | |
| Conditions: | |
| Anatomical Terms: | |
| Stage: | Day 6 |
| Fish: | |
|---|---|
| Conditions: | |
| Observed In: | |
| Stage Range: | Day 6 to Days 7-13 |