
Fig. 7
- ID
- ZDB-FIG-171206-29
- Publication
- Kozlovskaja-Gumbrienė et al., 2017 - Proliferation-independent regulation of organ size by Fgf/Notch signaling
- Other Figures
- All Figure Page
- Back to All Figure Page
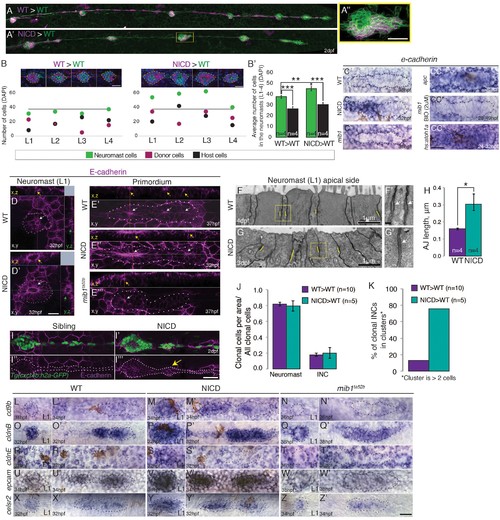
Notch cell-autonomously induces cell clustering. (A,B and B') Wildtype cells transplanted into a wildtype embryo do not cause larger neuromasts. (A'–B') Mosaic, NICD-positive cells that are transplanted into a wildtype embryo are clumping together and form bigger neuromasts. (A'') Mosaic L3 neuromast from panel (A') where NICD positive cells cluster together to form an enlarged neuromast. (B) Images at the top of the graph show 2 examples of L1-L4 neuromasts with clone cell numbers measured below. Left: WT cells transplanted into WT lateral line and right: NICD cells transplanted into WT lateral line. Colored dots below indicate three values measured for each neuromast: green- total number of cells in the neuromast, magenta- number of transplanted cells, black- number of host cells (a calculated value of magenta cells subtracted from the number of green cells). The grey line indicates the average neuromast size of all WT neuromasts containing WT clones. (B') Quantification of cell transplantation experiments. The significant increase in the neuromast size (green bars; 38 versus 45 cells) in NICD>WT experiments compared to WT>WT situation is only due to addition of transplanted NICD cells, since the number of host cells (black bar) is not significantly changed between two types of cell transplantation strategies (26 versus 30 cells). (C–CC'') e-cadherin expression in the primordium is upregulated by Notch (C') and by Wnt signaling (CC) compared to a wildtype primordium (C). (C'') e-cadherin is downregulated in mib1ta52b primordia and in mib1ta52b in which Wnt is activated with BIO (CC') suggesting that Wnt requires Notch signaling to induce e-cadherin. (CC'') e-cadherin is upregulated in hs:atoh1a primordia in which her4 (Notch target) is also expanded (see Figure 4—figure supplement 1C). (D–I''') Notch upregulates E-cadherin protein expression in neuromasts (D'), proneuromasts in the primordium (E'') and in interneuromast (INCs) cells (yellow arrow) (I''') compared to a wildtype sibling (D, E' and I,I''). In mib1ta52b embryos e-cadherin is downregulated (E'''). Strongest E-cadherin expression is marked by the yellow arrows in the x,z plane, white arrows in the x,y plane and green arrows in the y,z plane. (F–H) NICD causes a significant increase in apical adherens junction (AJ) lengths. (F' and G') Magnification of the areas in yellow boxes in F and G. AJs are marked by the white arrows. Error bar indicates standard error (p<0.05=* Student's t test). (I–I''') E-cadherin expression in the NICD interneuromast cells, which tend to form clusters (arrow), quantified in (K). (J) Transplanted NICD cells contribute in similar proportions to neuromasts and interneuromast cells as transplanted wildtype cells. (K) Transplanted NICD cells form significantly more clusters, as defined by groups of cells that contain two or more cells. (L–Z') Apical junction genes, such as adherens junction genes and tight junction components are upregulated by NICD. (L–N') cd9b is upregulated in NICD neuromasts and the primordium (M and M') compared to siblings (L and L'), and is downregulated in mib1ta52b embryos (N and N'). (O–Q') cldnB is upregulated in NICD neuromasts and the primordium (P and P) compared to a sibling (O and O') and slightly reduced in mib1ta52b embryos (Q and Q'). The cldnB signal is especially low in the center of mib1ta52b neuromasts (Q). (R–T') cldnE is upregulated in NICD neuromasts (S) compared to a sibling (R). cldnE is unchanged in mib1ta52b neuromasts (T). (R', S' and T') No change in cldnE expression is seen in wildtype, NICD and mib1ta52b primordia. (U–W') epcam is overexpressed in NICD neuromasts and the primordium (V and V') compared to siblings (U and U') but epcam is downregulated in mib1ta52b embryos (W and W'). (X–Z') celsr2 is overexpressed in NICD neuromasts and the primordium (Y and Y') compared to siblings (X and X') and mib1ta52b embryos (Z and Z'). All scale bars are 25 μm, unless stated otherwise. Error bars represent standard error (p<0.05=*, p<0.01=**, p<0.001=*** Student's t test). |