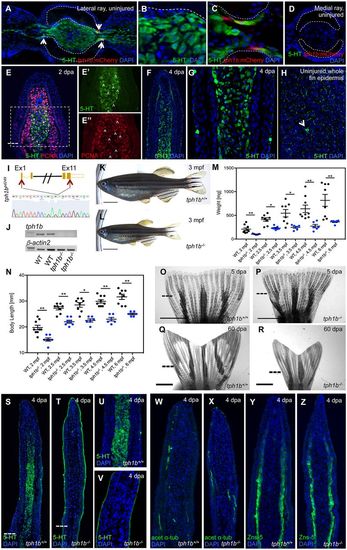
Tph1b is dispensable for fin regeneration but important for organismal growth. (A-D) Transverse section of lateral (A-C) or medial (D) rays of uninjured tph1b:mCherry caudal fins, stained for serotonin (5-HT, green) and nuclei (DAPI, blue). (B) Intracellular serotonin expression in fibroblasts. (C) Hemiray region shows tph1b+ cells (arrows) occasionally colocalized with serotonin staining. (D) Weak tph1b:mCherry expression, and no serotonin expression, in medial rays. Dashed lines outline the hemiray. (E) Longitudinal section of a 2 dpa blastema, stained for serotonin (5-HT, green), proliferating cells (PCNA, red) and nuclei (DAPI, blue). Serotonin is present in blastemal progenitors. Dashed line indicates the amputation plane. Separate channels for 5-HT (E′, green) and PCNA (E″, red) in the boxed area in E. Arrowheads indicate cells co-labeling for 5-HT and PCNA. Dashed line indicates the amputation plane. (F,G) Longitudinal sections of a 4 dpa blastema, stained for serotonin (5-HT, green) and nuclei (DAPI, blue). (G) Intracellular serotonin synthesis in fibroblasts and vesicular serotonin in some superficial epidermal cells. (F) 5-HT staining was occasionally detected in distal basal epithelial cells. (H) Optical section of uninjured whole caudal fin epidermis, stained for serotonin (5-HT, green) and nuclei (DAPI, blue). Stronger expression (arrow) in putative gland cells. (I) Schematic of the tph1b gene sequence, sgRNA target sites (red arrows, top) and chromatogram verification of tph1b sequence deletion (bottom). (J) RT-PCR for tph1b or β-actin2 on 3 dpa fins from tph1b−/− or wild-type siblings. tph1b mRNA (exons 6-7) is absent in tph1b−/− mutant fins. n=3 for each group. (K,L) Three mpf wild-type (J) or tph1b−/− (K) zebrafish. tph1b−/− fish are significantly smaller than wild-type siblings. At least four separate clutches were analyzed. (M,N) Mass (mg) (M) or body length (mm) (N) of wild type (black) or tph1b mutants (tph1b−/−, blue) (data are mean±s.e.m.). *P<0.01, **P<0.001; Mann–Whitney two-tailed test, n=6-9 per group. (O-R) Bright-field images of fins at 5 (O,P) or 60 dpa (Q,R). Wild-type (O,Q) and tph1b−/− (P,R) fins regenerate normally, despite differences in body size. Dashed lines indicate the amputation plane. (S-V) Longitudinal sections of wild-type (S) or tph1b−/− (T) fins at 4 dpa, stained for serotonin (5-HT, green) and nuclei (DAPI, blue). Higher magnification views are shown in U (tph1b+/+) and V (tph1b−/−). Serotonin synthesis is abrogated in tph1b−/− regenerating fins; epidermal 5-HT is still detected. Dashed lines indicate the amputation plane. (W-Z) Longitudinal sections of wild-type (V,Y) or tph1b−/− (W,Z) fin rays at 4 dpa, stained for osteoblasts (ZNS-5, green) (W,X) or nerves (acetylated α-tubulin, green) (Y,Z) and nuclei (DAPI, blue). tph1b−/− fins display normal osteoblast and nerve marker expression. Scale bars: 5 mm in K,L; 2 mm in O-R.
|
