|
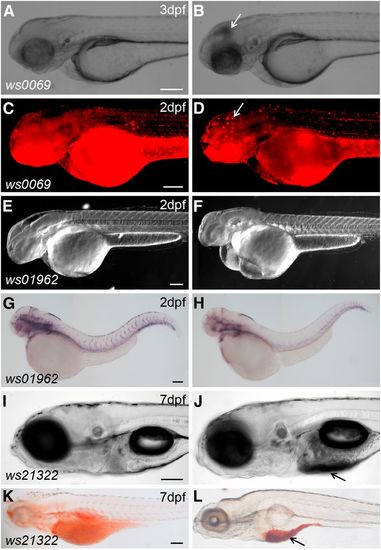
Representative mutant phenotypes in DsDELGT4 insertion lines. The Tg(DsDELGT4)ws0069 mutant shows cell death in the brain (B) compared to siblings (A) (bright field images). (C, D) Acridine Orange labeling to show cell death in the brain of mutant embryos (D) compared to siblings (C). White arrows in (B) and (D) show cell death in mutants. DIC images of Tg(DsDELGT4)ws01962 mutants showing smaller head and edema (F) compared to siblings (E). (G) and (H) In situ hybridization staining results with a probe to detect the endothelial marker flk1. Expression of flk1 is dramatically reduced in mutants (H) compared to siblings (G). Tg(DsDELGT4)ws21322 mutants exhibit fat metabolism defects (J) compared to siblings (I). (K) and (L) Oil red O staining in sibling (K) and mutant (L) embryos. Nonmetabolized fat is observed below the swim bladder in mutant embryos (arrows in J and L). Scale bars, 100 µm. Lateral views shown.
|