
Fig. 3
- ID
- ZDB-FIG-170914-1
- Publication
- Quach et al., 2015 - A Multifunctional Mutagenesis System for Analysis of Gene Function in Zebrafish
- Other Figures
- All Figure Page
- Back to All Figure Page
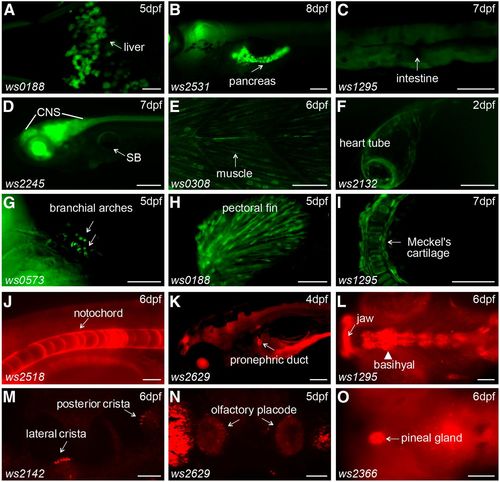
Reporter expression in various cell types. (A–I) Examples of enhancer trap reporter GFP expression patterns in the liver (A), pancreas (B), intestine (C), central nervous system (D), swim bladder (D), muscle cells (E), heart tube (F), branchial arches (G), fins (H), and cranial cartilage (I). (J–O) Examples of protein trap reporter mCherry expression patterns in notochord (J), anterior pronephric duct (K), mouth (L), inner ear (M), olfactory placode (N), and pineal gland (O). Ventral views are shown in (A) and (G). Lateral views are shown in (B–F), (H), (J), (K), and (M), with anterior to the left. Dorsal views are shown in (I), (L), (N), and (O). CNS, central nervous system; SB, swim bladder. Scale bars represent 100 µm in (B), 200 µm in (D), 20 µm in (J) and (M), and 50 µm in other images. |
| Genes: | |
|---|---|
| Fish: | |
| Anatomical Terms: | |
| Stage Range: | Long-pec to Days 7-13 |