
Fig. 2
- ID
- ZDB-FIG-170829-18
- Publication
- Förster et al., 2017 - An optogenetic toolbox for unbiased discovery of functionally connected cells in neural circuits
- Other Figures
- All Figure Page
- Back to All Figure Page
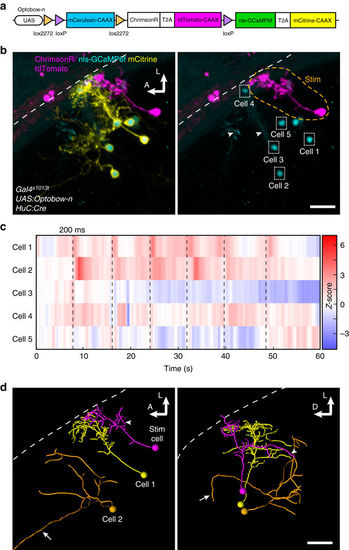
Simultaneous connectivity mapping and morphological analysis with Optobow-n. a Schematic of the Optobow-n construct. b Tectal-specific expression of Optobow-n. A single ChrimsonR-expressing cell (magenta) is surrounded by seven nls-GCaMP6f-expressing cells, membrane-labeled by mCitrine (yellow). Localization of GCaMP6f (cyan) appears completely restricted to the nucleus. White dashed line indicates skin. Orange dashed line in two-channel merge (right image) marks photostimulated region. Dotted rectangles show regions of calcium imaging during photostimulation. Arrowheads show mCerulean signals in non-recombined cells. Scale bar, 20 µm. c Calcium transients (Z-scores) acquired at 10 fps from the regions annotated in b. Photostimulation events of 200 ms are marked by dashed lines. While calcium activity of cell#1 is tightly coupled to the photostimulation, activity of cell#2 appears slightly delayed. No significant calcium responses were detectable in other neighbouring cells (#3–5). d Three-dimensional tracings of the photostimulated cell (magenta) and the two responding cells. Dorsal view is shown on the left and transverse view on the right. The stimulated cell is a bistratified projection neuron with a descending axon (arrowhead). Cell#1 is a bistratified periventricular interneuron and cell#2 is a non-stratified projection neuron, which sends an axon to the intertectal commissure (arrows). Scale bar, 20 µm |