
Fig. S1
- ID
- ZDB-FIG-170807-27
- Publication
- Passoni et al., 2017 - Imaging of viral neuroinvasion in the zebrafish reveals that Sindbis and chikungunya viruses favour different entry routes
- Other Figures
- All Figure Page
- Back to All Figure Page
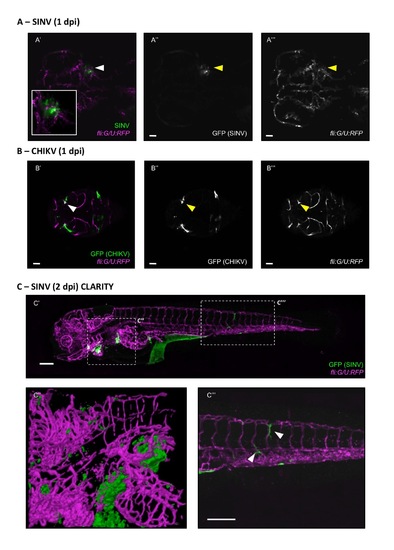
High magnification imaging of vasculature in infected larvae. Confocal imaging, single focal planes extracted from Fig. (3A') and (3D'). Scale bars: 50 μm. (A) SINV infection live imaging, from Fig. (3A'); (A') merge of green (infected cells) and magenta (endothelium) fluorescence; (A'') green (infected cells) fluorescence; (A''') magenta (endothelium) fluorescence. White and yellow arrowheads: infected areas close to but not part of the vasculature. (B) CHIKV infection, fixed sample labeled for GFP and RFP, from Fig. (3D'). (B') merge of green (infected cells) and magenta (endothelium) fluorescence; (B'') green (infected cells) fluorescence; (B''') magenta (endothelium) fluorescence. White and yellow arrowheads: areas of colocalization. (C'-C''') SINV infection, fixation at 2 dpi followed by clarity treatment and immunolabeling for GFP and RFP, lateral views; (C') Entire larva, boxes indicate the magnified areas in (C'') and (C'''); (C'') 3D rendering of the heavily infected area encompassing gills, liver, and hindbrain. See Movie 3, for rotation of the 3D structure; (C''') High magnification of the infected area in the tail region. White arrowheads: infected cells close to but not part of the vasculature. Scale bars: 150 μm. |