
Fig. 7
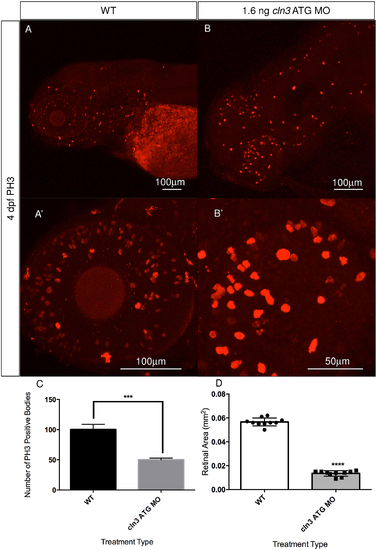
Cellular proliferation is abnormal in cln3 ATG MO morphant zebrafish. (A, A') Proliferation, assayed at 4 dpf using anti-PH3 (a marker of proliferative cells in mitotic M phase), is observed throughout the 4 dpf WT retina, jaw and the brain. (B, B') A marked reduction in the amount of cellular proliferation throughout the retina can be seen in the 1.6 ng cln3 ATG MO morphant. Although not quantified, it appears that proliferation in the morphant brain (B) is increased compared to WT. Confocal images are Z-projections. Scale bar: 100 μm (A, A', B) and 50 μm (B'). Lateral views. Anterior is to the left. Dorsal is up. (C) Quantification of these data show that the number of proliferating cells in the morphant retina is significantly reduced from 100.3 cells in WT to 50.3 cells in morphants; ***p<0.0006 (n = 3 zebrafish per group). (D) Quantification demonstrating a significantly reduced mean retinal area in the morphants (0.0566 mm2 for WT retinae compared to 0.0135 mm2 for morphant retinae; ****p<0.0001 (n = 10 zebrafish per group)). (C, D) Data represent mean ±SD; results were evaluated using a 2-tailed unpaired Student's t-test. |
| Fish: | |
|---|---|
| Knockdown Reagent: | |
| Observed In: | |
| Stage: | Day 4 |