
Fig. 5
- ID
- ZDB-FIG-170620-13
- Publication
- Erickson et al., 2017 - Integration of Tmc1/2 into the mechanotransduction complex in zebrafish hair cells is regulated by Transmembrane O-methyltransferase (Tomt)
- Other Figures
- All Figure Page
- Back to All Figure Page
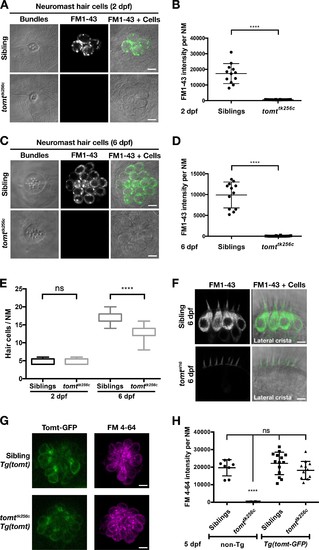
Tomt-deficient hair cells do not label with MET-channel permeant FM dyes. (A–D) FM 1–43 dye label of lateral line hair cells in 2 dpf (A, B) and 6 dpf (C, D) wild-type siblings and tomttk256c mutants. (A, C) Representative DIC images of NM hair bundles (left), fluorescence images of FM 1–43 in the same NMs (middle), and a merge of the FM 1–43 images with DIC images of the hair cell bodies (right) from 2 dpf (A) and 6 dpf (C) wild-type siblings and tomttk256c mutants. (B, D) Quantification of FM 1–43 fluorescence intensity per NM of 2 dpf (B) and 6 dpf (D) wild-type siblings (n = 6 larvae; 2 NMs each) and tomttk256c mutants (n = 8 larvae; 2 NMs each). Error bars are the mean ± SD. Asterisks indicate p<0.0001 by unpaired, two-tailed t-test. (E) Quantification of hair cell number per neuromast in 2 dpf and 6 dpf tomttk256c mutants and wild-type siblings (same as those shown in panels A – D). The box plots cover the 25th to 75th percentiles, and the whiskers represent the minimum and maximum counts. ns = not significant, asterisks indicate p<0.0001 by unpaired, two-tailed t-test. (F) Representative images of FM 1–43 labeling of inner ear hair cells in 6 dpf wild-type siblings (n = 5 larvae) and tomtnl16 mutants (n = 7 larvae). (G) Rescue of FM dye labeling in mercury mutants by stably expressed Tomt-GFP. Representative images of Tomt-GFP (left panels) and FM 4–64 (right panels) in lateral line NMs of a Tg(myo6b:tomt-GFP) wild-type sibling and a Tg(myo6b:tomt-GFP);tomttk256c mutants at 5 dpf. Tomt-GFP and FM 4–64 images are from the same NM for each genotype. (H) Quantification of FM 4–64 fluorescence intensity per NM for 5 dpf non-transgenic wild-type siblings (n = 6 larvae, 8 NMs), non-transgenic tomttk256c mutants (n = 6 larvae, 12 NMs), Tg(myo6b:tomt-GFP) wild-type siblings (n = 7 larvae, 14 NMs), and Tg(myo6b:tomt-GFP);tomttk256c mutants (n = 6 larvae, 12 NMs), including those NMs shown in F. Error bars are the mean ± SD. ns = not significant. Asterisks indicate p<0.0001 by one-way ANOVA with Bonferroni's multiple comparison test. Scale bars: 5 µm in A, C, F, and G. |
| Fish: | |
|---|---|
| Observed In: | |
| Stage Range: | Long-pec to Day 6 |