
Fig. S1
- ID
- ZDB-FIG-170519-8
- Publication
- Trinh et al., 2017 - Biotagging of Specific Cell Populations in Zebrafish Reveals Gene Regulatory Logic Encoded in the Nuclear Transcriptome
- Other Figures
- All Figure Page
- Back to All Figure Page
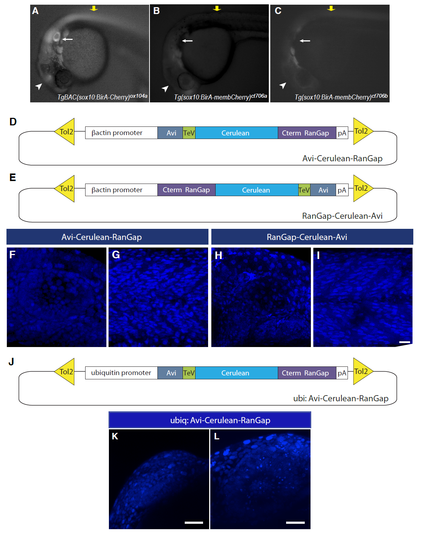
Biotagging sox10 BirA drivers and Avi-tagged RanGap effectors. Related to Figures 1 and 2. A-C Differential expression between sox10 biotagging transgenic and BAC drivers. Wide-field image of TgBAC(Sox10:BirA-mCherry)ox104a (ncBirA(BAC)) (A). Tg(Sox10:BirA-membCherry)ct706a (ncBirA) and Tg(Sox10:BirA-membCherry)ct706bsox10 Biotagging transgenic exhibit expression in different neural crest derivatives that are included in the overall sox10 expression pattern, by sox10 Biotagging BAC (A). Arrow points to lack of expression in the otic vesicle, while arrowheads point to lack of expression in the midbrain of sox10 transgenes. D-L Biotagging Avi-tagged nuclear localized effectors. Schematic of two variant Avi-tagged RanGap constructs for generating Avi effector transgenes. N-terminal Avi-tag construct (Avi-Cerulean-Rangap) contains the beta-actin2 (β actin) promoter upstream of Avi-tag (steelblue), the Tobacco Etch Virus protease cleave site (TeV, green), Cerulean (turquoise), the C-terminal domain of RanGap (purple), and a polyA signal (D). C-terminal Avi-tag construct (RanGap-Cerulean-Avi) contains the beta-actin2 ( βactin) promoter upstream of the C-terminal domain of RanGap (purple), Cerulean (turquoise), the Tobacco Etch Virus protease cleave site (TeV, green), Avi-tag (steelblue), and a polyA signal (E). Both constructs are flanked by tol2 elements (yellow) for transgenesis by Tol2 transposition. 3-D projection of confocal Z-stack of Avi-RanGap (F-G) and RanGap-Avi (H-I) of the developing inner ear (F, H) and somite (G, I), imaged at 32hpf. Both Avi-Cerulean-RanGap and Rangap-Cerulean-Avi proteins localize similarly to the nucleus of all cells in the embryo. Schematic of Avi-RanGap effector construct with ubiquitin promoter (ubiq) upstream of N-terminal Avi tagged RanGap elements (J). Confocal image of hindbrain (K) and eye (L) of Tg(ubiq:Avi-RanGap) embryo (nucAvi(ubiq)). Scale bars: 20 μm, except 50 μm in (K, L). |