
Fig. 1
- ID
- ZDB-FIG-170519-5
- Publication
- Trinh et al., 2017 - Biotagging of Specific Cell Populations in Zebrafish Reveals Gene Regulatory Logic Encoded in the Nuclear Transcriptome
- Other Figures
- All Figure Page
- Back to All Figure Page
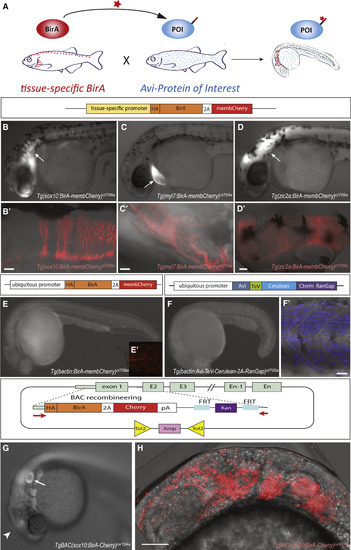
Genetically Encoded Biotagging Toolkit in Zebrafish (A) Schematic of the binary transgenic system for cell-type-specific in vivo biotinylation. BirA drivers are in red and Avi effector lines in blue. POI, protein of interest. (B–E) Widefield fluorescent image of biotagging drivers expressing BirA under the sox10 (B), myl7(C), and zic (D), or ubiquitous (E, βactin) promoters; schematics of the transgenic constructs are shown above the images. (B′–E′) Corresponding confocal images of BirA-equivalent membCherry expression in the pharyngeal arches and hindbrain (white arrow, B), myocardium (white arrow, C), and hindbrain (white arrow, D). (F) Widefield image of Avi-RanGap(nucAvi) effector with schematic of transgenic construct above image. (F′) Confocal image of Avi-RanGap expression in the somite. (G and H) Widefield fluorescent (G) and projection of confocal (H) microscope images of ncBirA(BAC) driver with schematic of recombineering BAC cassette and tol2 containing BAC. Arrow points to otic vesicle, and arrowheads point to midbrain expression. Scale bars represent 50 μm (B′–D′) and 20 μm (F′ and H). |