
Fig. 4
- ID
- ZDB-FIG-170503-5
- Publication
- Vibert et al., 2017 - An ongoing role for Wnt signaling in differentiating melanocytes in vivo
- Other Figures
- All Figure Page
- Back to All Figure Page
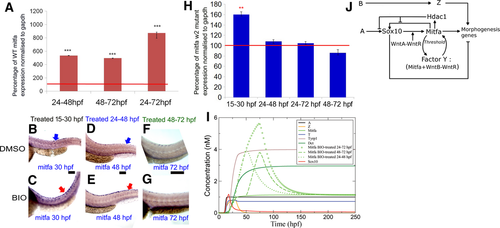
Positive feedback between Wnt signaling and Mitfa during late differentiation phase of melanocyte development. (A) Quantitation of mitfa expression by RT-qPCR showing significantly increased levels in BIO-treated embryos compared with untreated controls; data are expressed as percentage of mock-treated controls [control mitfa level = 100% transcripts (red line on graph)]. Gene expression was investigated in 10 samples consisting of the trunk and tail of 50 embryos for each condition and in triplicate, after normalization to the stable expression of a reference house-keeping gene, gapdh. All treatments caused significant increase of mitfa expression [t test, two-tailed: 24–48 hpf, 535 ± 7.1 (P = 0.00087); 48–72 hpf, 496 ± 9.8 (P = 0.0085); 24–72 hpf, 872 ± 32.1 (P = 0.000092). ***P-value < 0.001]. (B–G) Activating Wnt signaling after 48 hpf does not affect mitfa expression in mitfaw2 mutant embryos during melanocyte differentiation. Lateral views of trunk showing in situ hybridisation for mitfa expression in mitfa mutant fish. mitfa mutant embryos treated with BIO in the melanocyte specification phase (15–30 hpf) (C) showed increased mitfa expression (purple) compared to DMSO-treated embryos (B). Similarly, mitfa mutant embryos treated with BIO in the melanocyte early differentiation phase (24–48 hpf) (E) showed increased mitfa expression in tail dorsal stripe melanocytes compared to DMSO-treated embryos (D). In contrast, mitfa mutant embryos treated with BIO throughout the late melanocyte differentiation phase (48–72 hpf) (G) did not show increased mitfa expression compared to DMSO-treated embryos (F) at 72 hpf; 40 zebrafish embryos were investigated for each condition; BIO-treated and matched control embryos were processed for in situ hybridisation in parallel and under identical conditions. (H) Quantitation of mitfa expression by RT-qPCR showing significantly increased levels in BIO-treated embryos at 30 hpf compared with untreated controls but not at 48 hpf nor at 72 hpf; data are expressed as percentage of mock-treated controls [control mitfa level = 100% transcripts (red line on graph)]. Gene expression was investigated in triplicate, after normalization to the stable expression of a reference housekeeping gene, gapdh. Only 15–30 hpf treatment caused significant increase of mitfa expression [t test, two-tailed: 15–30 hpf, 160.39 ± 7.27 (P = 0.0020); 24–48 hpf, 108.15 ± 7.9 (P = 0.0675); 24–72 hpf, 104.6 ± 8.36 (P = 0.544); 24–72 hpf, 86.14 ± 8.96 (P = 0.0831). **P-value < 0.01]. (I) The effect of the three BIO treatments applied in the 24–48, 48–72, and 24–72 hpf time windows is shown on Mitfa only as compared to the case of no treatment. The 24–48 and 48–72 hpf BIO treatments induce an approximately equal increase of Mitfa as measured at the end of the treatment. (J) Revised GRN model. Scale bars: 100 μm. |