
Fig. 2
- ID
- ZDB-FIG-170503-3
- Publication
- Vibert et al., 2017 - An ongoing role for Wnt signaling in differentiating melanocytes in vivo
- Other Figures
- All Figure Page
- Back to All Figure Page
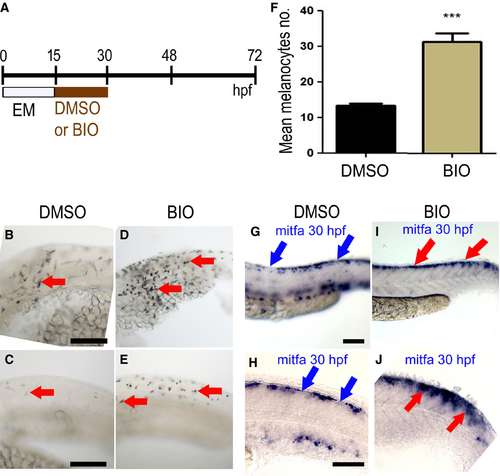
Elevated Wnt signaling in melanocyte specification time window increased numbers of melanocytes. (A) Schematic showing timing of BIO treatment or control mock treatment (DMSO alone) used. (B–E) Lateral views of the trunk of live 30 hpf zebrafish embryos showing melanocytes (red arrows); note, increased number in both anterior (D) and posterior trunk (E) of embryos treated with 5 μM BIO compared with control DMSO-treated embryos (B, C, respectively). (F) Quantitation of increased melanocyte number in heads of BIO-treated embryos (mean ± SD; control, 13 ± 2.1; BIO, 32 ± 5.3, P < 10−6) (n = 20; *** indicates significant difference between treated and mock treated; unpaired, one-tailed t test). (G–J). Lateral views of posterior trunk (G, I) and close-up of anterior tail (H, J) of 30 hpf zebrafish embryo in situ hybridisations to show mitfa expression in embryos treated with BIO (I, J) or DMSO control (G, H). In the DMSO control embryos (G, H), discontinuous mitfa expression is observed in the dorsal region (blue arrows show discontinuities of the signal), whereas in the BIO-treated embryos (I, J), mitfa expression is continuous throughout the dorsal region (red arrows). Images show representative phenotypes (n = 20 per treatment). Scale bar: 100 μm. |