
Fig. 4
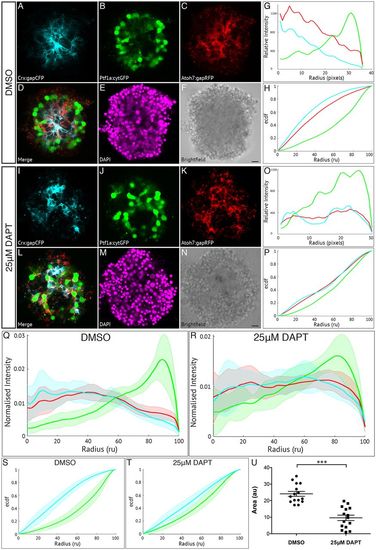
Müller glia are important in zebrafish retinal self-organisation. Fluorescence profiles are generated for SoFa1 aggregates treated either with 25 μM DAPT to prevent the differentiation of Müller glia or with DMSO as a control. (A-F) Central sagittal section of a SoFa1 aggregate treated with DMSO. (A) Crx:gapCFP-expressing cells are found in the centre of the aggregate. (B) Ptf1a:cytGFP-expressing cells are found in a ring around the edge of the Crx:gapCFP population. (C) Atoh7:gapRFP-expressing cells are found throughout the aggregate. (D) Merge of channels represented in A-C. (E) DAPI. (F) Bright-field image. Scale bar: 10 μm. (G) Fluorescence profiles for the aggregate represented in A-F. (H) ECDF plot for the aggregate represented in A-F. (I-N) Central sagittal section of a SoFa1 aggregate treated with 25 μM DAPT. (I) Some Crx:gapCFP-expressing cells are found in the centre of the aggregate, and some are found nearer the edge. (J) Ptf1a:cytGFP-expressing cells are found throughout the aggregate. (K) Atoh7:gapRFP-expressing cells are found throughout the aggregate. (L) Merge of channels presented in I-K. (M) DAPI. (N) Bright-field image. Scale bar: 10 μm. (O) Fluorescence profiles for the aggregate represented in I-N. (P) ECDF plot for the aggregate represented in I-N. (Q) Average fluorescence profiles with shaded error for aggregates treated with DMSO (n=15, three experimental repeats). (R) Average fluorescence profiles with shaded error for aggregates treated with 25 μM DAPT (n=15, three experimental repeats). (S) Average ECDF plots for aggregates treated with DMSO. (T) Average ECDF plots for aggregates treated with 25 μM DAPT. (U) Area (in arbitrary units) is calculated between the ECDF for the Crx:gapCFP population and the ECDF for the Ptf1a:cytGFP population of cells, and compared between aggregates treated with DMSO and aggregates treated with 25 μM DAPT (n=15 for each condition, Mann–Whitney two-tailed t-test, P<0.0001). |