
Fig. 3
- ID
- ZDB-FIG-170414-14
- Publication
- Plamont et al., 2016 - Small fluorescence-activating and absorption-shifting tag for tunable protein imaging in vivo
- Other Figures
- All Figure Page
- Back to All Figure Page
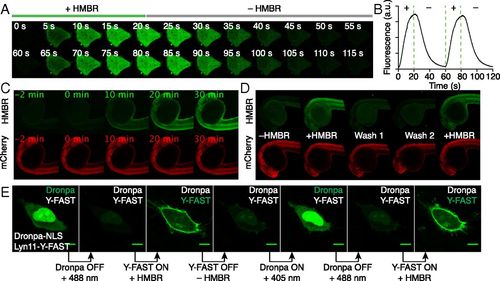
On/off fluorescence switching by iterative labeling/unlabeling. (A and B) HeLa cells expressing mCherry-Y-FAST were grown in a microfluidic channel and repeatedly incubated with HMBR-containing culture medium for 20 s and HMBR-free culture medium for 40 s. A multifunctional fluidic controller enabled several cycles of labeling/unlabeling. HMBR concentration was 5 μM. (A) Confocal time lapse showing two cycles of labeling/unlabeling (Ex/Em 488/493–575 nm). Movie S2 shows 10 cycles of labeling/unlabeling. (B) Temporal evolution of the cell fluorescence upon addition (+) and removal (–) of HMBR. (C) Confocal time lapse showing the labeling kinetics in a zebrafish embryo expressing Y-FAST and mCherry (HMBR channel: Ex/Em 491/525–539 nm; mCherry channel: Ex/Em 561/605–664 nm). HMBR concentration was 10 μM. See also Movie S3. (D) A zebrafish embryo expressing Y-FAST and mCherry was imaged before addition of HMBR (–HMBR), 20 min after incubation with 10 μM HMBR (+HMBR), after two washings of 20 min (Wash 1 and 2), and after reincubation with 10 μM HMBR (+HMBR). (E) Confocal micrographs of live HeLa cells expressing Dronpa−NLS (nucleus) and lyn11−Y-FAST (membrane) showing sequential imaging of nuclear Dronpa and membrane-anchored Y-FAST through sequential on/off labeling of Y-FAST intercalated with on/off photoswitching of Dronpa (Ex/Em 488/493–797 nm). HMBR concentration was 5 μM. (Scale bars, 10 μm.) |