
Fig. S1
- ID
- ZDB-FIG-170320-9
- Publication
- Ramspacher et al., 2015 - Developmental Alterations in Heart Biomechanics and Skeletal Muscle Function in Desmin Mutants Suggest an Early Pathological Root for Desminopathies
- Other Figures
- All Figure Page
- Back to All Figure Page
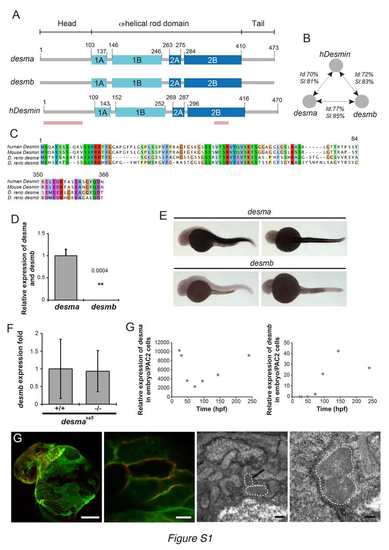
desma is the main ortholog of desmin in zebrafish and Myocardial Desma aggregates present membrane localization (related to Fig.1). (A) Scheme showing the structural homology between zebrafish desma, desmb and human desmin. Pink lines show the position, where the alignments were not complete and are presented in C. (B) Scheme showing results of identity (Id) and similarity (SI) calculated by alignment of desma, desmb and human desmin (hdesmin). Alignment and calculations were performed on ClustalW2. (C) Protein sequence alignments of regions of lower similarity between mouse, human desmin and zebrafish desmin a (zdesma) and desmin b (zdesmb). (D) qPCR of desma and desmb on RNA extracted from pools of WT 48hpf embryos shows a 2500 fold enrichment in desma compared to desmb. (E) In situ hybridization confirms the low expression of desmb compared to the clear desma signal observed in all muscle cell types of 30hpf zebrafish embryos (skeletal muscle and myocardium, no smooth muscle present at this stage). Scale bar=300μm. (F) qPCR on RNA extracted from pools of WT and desmasa5-/- shows that desmb expression is not altered in desmaSa5-/-. (G) qPCR on RNA made from pools of WT zebrafish larvae from 30hpf to 14dpf show the evolution of desma and desmb expression over time. Expression levels are given relative to the expression in PAC2 zebrafish cells. Desma expression is high at early stages and decreases around 50 hours to increase again linearly from 50 to 250 hpf. Desmb expression is very low until 96 hpf and then peaks at 150 hpf but without reaching levels comparable to desma enrichment. (G) Z-stack maximal projection of confocal images of ct122aRGt; Tg(myl7:ras-eGFP)s883 and electron micrograph in ct122aRGt myocardium in 48hpf embryos. Tg(myl7:ras-eGFP)s883 marks the cardiomyocyte membrane and colocalizes with the mCherry-positive aggregates. Upper left panel: Scale bar=50μm. Upper right panel: Scale bar = 5μm. Lower left panel: Scale bar = 0.5μm. Lower right panel: Scale bar = 200nm. Black arrow shows the position of an aggregate observed in a cardiomyocyte. ct122aRGt indicates desmact122aRGt homozygous embryos. (D, F) Error bars indicate the standard deviation. |