
Fig. 1
- ID
- ZDB-FIG-170320-2
- Publication
- Ramspacher et al., 2015 - Developmental Alterations in Heart Biomechanics and Skeletal Muscle Function in Desmin Mutants Suggest an Early Pathological Root for Desminopathies
- Other Figures
- All Figure Page
- Back to All Figure Page
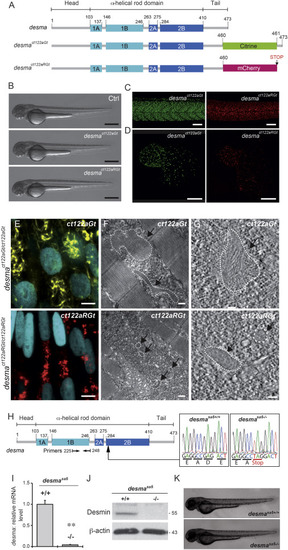
Desmin Flip Trap Fish Lines, desmact122aGt and desmact122aRGt, Enable Formation and Visualization of Desmin Aggregates while the desmasa5−/− Allele Leads to a Loss of desma Transcripts (A) Schematic drawing of the desma gene in WT, desmact122aGt or ct122aGt (with citrine fusion), and desmact122aRGt or Ct122aRGt (with mCherry fusion) fish lines. The ct122aRGt line presents a 13-amino-acid deletion at the end of the tail domain, and the ct122aGt line presents a full desma sequence containing the citrine fluorescent protein. (B) Side views of ct122aGt and ct122aRGt zebrafish embryos at 55 hpf. Scale bar, 500 μm. (C and D) Desmin aggregates are observed in skeletal muscles (scale bar, 100 μm) (C) and in the myocardium (scale bar, 50 μm) (D) in ct122aGt and ct122aRGt 48-hpf embryos. (E–G) Semicorrelative light and electron microscopy of skeletal muscles of ct122aGt and ct122aRGt 48-hpf embryos. (E) Confocal micrograph at high magnification of ct122aGt and ct122aRGt embryos. Nuclei are labeled with H2B-Cerulean. Scale bar, 5 μm. (F) Electron micrograph analyses of the same region showed cytosolic aggregates (the black arrows are pointing to the aggregates circled by the dotted lines) in ct122aGt and ct122aRGt embryos. Scale bar, 200 nm. (G) Electron tomography at high magnification showing filamentous aggregate structures in ct122aGt and compact aggregates with regular condensed structure in the ct122aRGt (the black arrows are pointing to the aggregates circled by the dotted lines). Scale bar, 100 nm. ct122aGt and ct122aRGt refers to homozygous embryos. (H) Scheme of the WT desma gene in zebrafish. Arrow indicates the position of the mutation in the desma gene sequence. Sequencing of genomic DNA from desmasa5+/+ and desmasa5−/− larvae reveals a G to T mutation resulting in a stop codon that leads to truncated Desma in desmasa5−/− mutants. (I) Reverse transcriptase qPCR on RNA extracted from pools of WT and desmasa5−/− mutants demonstrates defective amplification of the mutant transcripts of exons 3–4 demonstrating that the corresponding mRNA is degraded. The primers used for qPCR are highlighted in (A). (J) Immunoblot of 2 dpf WT and desmasa5−/− mutants demonstrating full knockdown of Desma protein. (K) Side views of zebrafish desmasa5+/+ and desmasa5−/− embryos at 55 hpf. Scale bar, 500 μm. The error bars correspond to the SEM. |
| Genes: | |
|---|---|
| Fish: | |
| Anatomical Terms: | |
| Stage: | Long-pec |
| Fish: | |
|---|---|
| Observed In: | |
| Stage: | Long-pec |