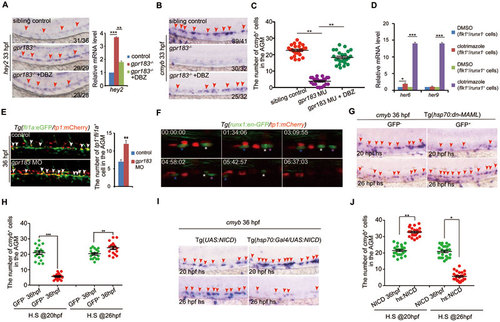
Downregulation of Notch signaling is required for definitive hematopoiesis. (A) The increase in hey2 expression in gpr183 mutant is reversed by DBZ treatment. Right panel shows the qPCR quantification. (B) The decrease in cmyb expression in gpr183 mutant is reversed by DBZ treatment. In A and B, red arrowheads indicate hey2 or cmyb expression in the AGM region at 33 hpf. (C) Dot-plot analysis of cmyb+ cell numbers in AGM. (D) Clotrimazole treatment increases expression levels of her6 and her9 in flk1+runx1+ cells at 28 hpf. (E) Notch-active endothelial cells increase in gpr183 morphant (n = 15 for control and morpholino treatment). Right panel shows the quantification analysis. (F) EHT from 37 (shown as 00:00:00) to 43 hpf in Tg(runx1:en-GFP/tp1:mCherry) embryo. Asterisks label individual cells. (G, H) cmyb expression in the AGM region of control embryos and embryos in which Notch signaling is inhibited. Tg(hsp70:dn-MAML) embryos expressing a dominant negative (dn) isoform of the murine mastermind-like (MAML) protein fused to GFP under a hsp70 promoter were heat shocked at 20 or 26 hpf; cmyb expression was examined at 36 hpf. GFP− embryo serves as a control. Representative images are shown in G and the dot-plot quantification analysis is shown in H. (I, J) cmyb expression in the AGM region of control and Notch signaling-activated embryos. Tg(UAS:NICD) (NICD, control) and Tg(hsp70:GAL4/UAS:NICD) (hs:NICD) embryos were heat shocked at 20 or 26 hpf and cmyb expression was examined at 36 hpf. Representative images are shown in I, and the dot-plot quantification analysis is shown in J. In G and I, red arrowheads mark the staining signals in AGM. Error bar represents SD. *P < 0.05, **P< 0.01, ***P < 0.001.
|
