
Fig. S3
- ID
- ZDB-FIG-170309-8
- Publication
- Reinig et al., 2017 - The Descending Diencephalic Dopamine System Is Tuned to Sensory Stimuli
- Other Figures
- All Figure Page
- Back to All Figure Page
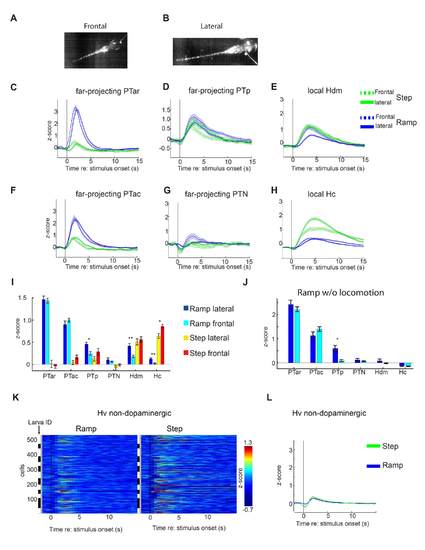
(A, B) High-speed camera single image of 4 dpf old larvae for frontal and lateral tactile stimulation on the head. The platinum wire and a small reflection on its tip are visible. (C-H) Mean calcium activity as z-score for all cells of the different dopaminergic subgroups for Ramp and Step stimuli applied laterally (solid line) or frontally (dashed line). Shaded areas correspond to the SEM. (I) Mean time-averaged calcium activity (see Statistics) as z-score for all cells of each dopaminergic subgroup for Ramp and Step head stimulation in the frontal and lateral stimulus configuration. While the stimulus location did not make a difference in most cases, laterally applied Ramp stimuli resulted in significantly stronger calcium responses in PTp, Hdm and Hc neurons, when compared to frontally applied ones, and frontally applied Step stimuli resulted in stronger responses than laterally applied ones in Hc (** p<0.01; * p <0.05, Mann-Whitney-U test, Bonferroni corrected, comparisons n=6) Error bars SEM. Number of neurons frontal/lateral: PTar 30/17; PTac: 42/26; PTp 27/27; PTN 50/13; Hdm 70/49; Hc 133/95. (J) Mean time-averaged calcium responses to frontal and lateral Ramp stimuli for trials in which no locomotion occurred. The lack of a stimulus position-dependent response difference in Hdm and Hc suggests that the differences observed in (I) are locomotion dependent. However, in PTp, the difference between responses to frontal and lateral Ramp stimuli is still significant (* p <0.05, Mann-Whitney-U test, Bonferroni corrected, comparisons n=6). Error bars: SEM. (K) Mean calcium activity (z-score) of single cells in the ventral hypothalamus (Hv) of 4 to 5 dpf old gSA2Az-Gal4FF; UAS:GCaMP7a larvae after the onset (t = 0 s, black line) of Ramp (left) and Step (right) stimuli. Black and white bars each indicate different animals. (L) Mean calcium activity of all cells of the Hv region synchronized to the onset of Ramp (blue) and Step (green) stimuli. The shaded area represents the standard error of the mean. The Hv region is devoid of dopaminergic neurons. |