
Fig. S5
- ID
- ZDB-FIG-170220-13
- Publication
- Mayrhofer et al., 2017 - A novel brain tumour model in zebrafish reveals the role of YAP activation in MAPK/PI3K induced malignant growth
- Other Figures
- All Figure Page
- Back to All Figure Page
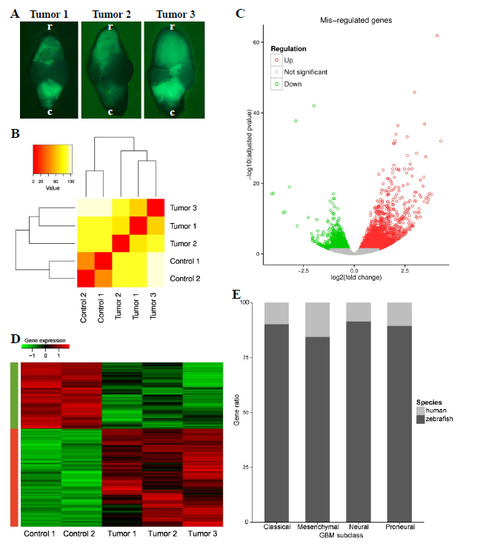
Quality control for zebrafish model RNAseq results. A) Dorsal view of stereo images of whole brains from zic:RASsomatic used for RNAseq analysis (r=rostral, c=caudal). B) Hierarchical clustering of control and tumour samples using Euclidean distance on gene expression grouped the samples according to tumour or control. C) The volcano plot represents all known zebrafish genes for which a differential expression analysis was done. The significantly differentially expressed (DE) genes (adjusted p‑value<0.05) are coloured in red (up-regulated) or green (down-regulated). D) After clustering of significantly (adjusted p-value<0.05) DE genes based on normalised expression, the genes clustered according to regulation, verifying the efficiency of the normalisation step. E) After the identification of the zebrafish orthologs of the 840 GBM human markers, through Ensembl annotation and manual refinement, more than 80 % of genes could be identified for all four GBM subclasses. |