
Fig. S3
- ID
- ZDB-FIG-170208-55
- Publication
- Davey et al., 2016 - PCP Signaling between Migrating Neurons and their Planar-Polarized Neuroepithelial Environment Controls Filopodial Dynamics and Directional Migration
- Other Figures
- All Figure Page
- Back to All Figure Page
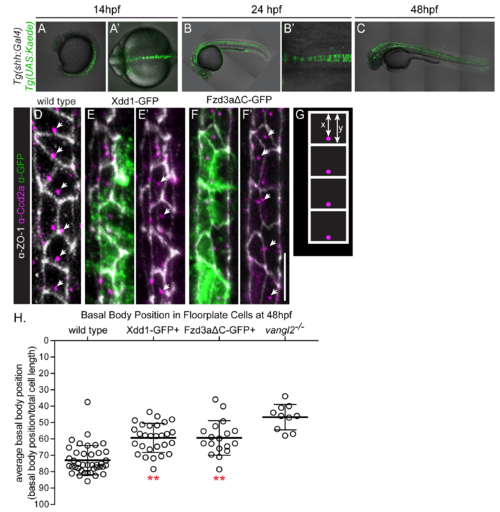
PCP-DN expression in the floorplate disrupts planar polarity. (A-C) Tg(shh:Gal4) driven expression of Tg(UAS:Kaede) in the notochord and floorplate of a 14 hpf (A) 24 hpf embryo (B) and a 48 hpf embryo (C). Anterior is to the left. Images are live lateral views in A-C and live dorsal views at the hindbrain level, A',B'. (D-F) Confocal images showing floorplate planar polarity of the anterior spinal cord in 48 hpf zebrafish embryos. Anterior is to the top. Anti-ZO-1 marks subapical tight junctions (white), anti-Cc2d2a marks the basal bodies of the primary cilia (magenta, arrows), and anti-GFP indicates dominant negative protein expression (green). Scale bar: 10μm. Whereas basal bodies are localized toward the posterior membrane in wild type embryos (D), this polarity is disrupted in floorplate cells expressing Xdd1-GFP (E) or Fzd3aΔC-GFP (F) (arrows in E' and F'). (G) Schematic of the method used to quantify floorplate planar polarity. Total cell length (x) is measured as the distance between the anterior and posterior membranes (white) at the level of the basal body (magenta). Basal body position (y) is measured as the distance between the anterior membrane and the basal body. Cellular planar polarity is quantified as the ratio of x/y. (H) Quantitation of average basal body position in the floor plate of 48 hpf embryos. Each data point represents the mean basal body position for all cells quantitated in a single embryo. WT: N = 34 embryos, 411 cells; Xdd1-GFP: N = 14 embryos, 207 expressing cells; FzdΔC-GFP: N = 29 embryos, 484 expressing cells; vangl2-/-: N = 10 embryos, 96 cells. Quantitation of floorplate polarity in vangl2-/- embryos is included for comparison. Graph represents data as mean ± SD. **p<0.0001 compared to wild-type control. |