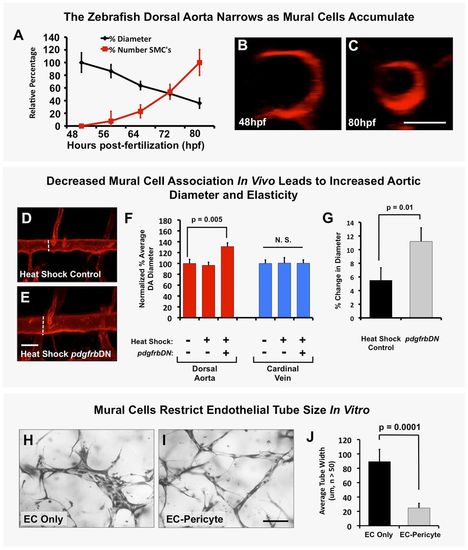
Mural cells regulate aortic diameter and elasticity. (A) Accumulation of vSMCs on the dorsal aorta inversely correlates with reduced dorsal aorta diameter over time during zebrafish vascular development. Dorsal aorta diameter is normalized to starting 48 hpf value and vSMC number is normalized to final 80 hpf value. n=3 fish. (B,C) Representative 2 dpf (B) and 3.25 dpf (C) transverse reconstructions of confocal images of the dorsal aorta in Tg(kdrl:mCherryCAAX) transgenic zebrafish, shown at the same magnification. (D,E) Loss of mural cell coverage leads to expansion of the zebrafish dorsal aorta. Representative 5 dpf confocal images of the mid-trunk dorsal aorta in Tg(kdrl:mCherryCAAX), Tg(tagln:egfp), Tg(HSP70:gal4) control (D) or Tg(kdrl:mCherryCAAX), Tg(tagln:egfp), Tg(HSP70:gal4), Tg(UAS:pdgfrbDN-YFP) dominant negative pdgfrbDN transgene-expressing (E) embryos that were heat shocked for a full 1-5 day time course. (F) Quantification of dorsal aorta diameter, demonstrating marked expansion of the dorsal aorta in heat shock pdgfrbDN fish compared with non-heat shocked or heat shocked control siblings. No effects were noted on the diameter of the cardinal vein. A minimum of three fish were measured per sample, with ten separate dorsal aorta measurements per fish. Experiments were repeated three times showing consistent results; N.S., not significant. (G) Loss of vSMC coverage leads to increased elasticity of the dorsal aorta in the developing zebrafish embryo. Heat shock control (maintains vSMC coverage) versus heat shock pdgfrbDN (demonstrates marked loss of vSMC coverage) fish were imaged using SPIM. Images were acquired at 22 frames per second to capture the movement of the wall of the dorsal aorta (‘elasticity’) as it expands and retracts in accordance with the animal's heartbeat. Data are reported as a percentage diameter change [(maximal width of the aorta-minimal width of the aorta)/minimal width of the aorta×100]. Five fish were measured per sample, with three separate dorsal aorta measurements taken per fish. Mean±s.e.m. (H-J) Regulation of EC tube diameter by mural cells can be modeled in 3D collagen matrix assays in vitro. Representative images of EC-only culture (H) and EC-pericyte co-cultures (I) are shown. (J) Quantification of endothelial tube diameter in EC-only cultures and EC-pericyte co-cultures established in 3D collagen matrices, showing a marked reduction in EC tube diameter in the presence of mural cells (pericytes). n=5 images from separate collagen plugs, ten measurements per image. Scale bars: 50 µm. Values are mean±s.d.
|
