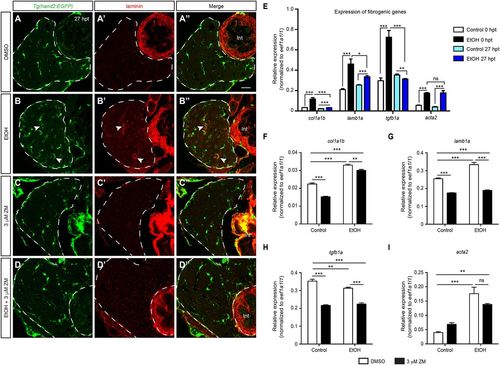
VEGFR inhibition attenuated fibrogenic responses post-acute ethanol treatment. (A-D″) Confocal single-plane images from the vibratome transverse sections showing that ZM treatment after acute ethanol exposure suppressed laminin deposition. (A-D) HSCs marked by Tg(hand2:EGFP) expression; (A′-D′) laminin deposition; and (A″-D″) merged images of the two. Dashed line marks the liver. Scale bar: 20 μm. Ten larvae were examined in each experimental group. Arrowheads in B-B″ point to the HSCs that secreted laminin. Int, intestine. (E) qPCR analyses showing the comparison of col1a1b, lamb1a, tgfb1a, and acta2 expression in control and ethanol-treated livers at 0 and 27 hpt. (F-I) qPCR analyses showing the comparison of col1a1b (F), lamb1a (G), tgfb1a (H), and acta2 (I) expression in the livers of larvae treated with DMSO, ZM, ethanol followed by DMSO, and ethanol followed by ZM at 27 hpt. (E-I) Triplicates were performed. The results are represented as relative expression levels that are normalized to the housekeeping gene eef1a1l1 (mean±s.e.m.). Statistical significance was calculated by one-way ANOVA and Tukey's post-hoc test. *P<0.05; **P<0.01; ***P<0.001; ns, not significant.
|
