
Fig. S6
- ID
- ZDB-FIG-161206-16
- Publication
- Zhang et al., 2016 - Inhibition of vascular endothelial growth factor signaling facilitates liver repair from acute ethanol-induced injury in zebrafish
- Other Figures
- All Figure Page
- Back to All Figure Page
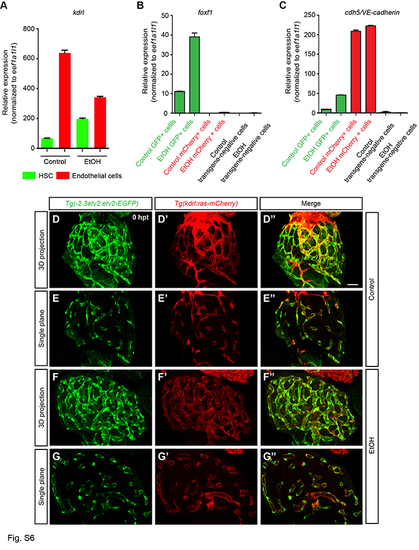
Confirmation of the purity of the FACS-sorted HSC, endothelial cells, and parenchymal cell population. (A) qPCR analyses show that in WT larval livers that were not treated with ethanol, the expression of kdrl was 9.8-fold higher in the FACS-sorted endothelial cells than in the FACS-sorted HSCs at 0 hpt. In the ethanol-treated larvae, the expression of kdrl was 1.7-fold higher in the endothelial cells than in the HSCs. (B) The hepatic stellate cell marker foxf1 (Yin et al., 2012) was only expressed in the Tg(hand2:EGFP)-positive cells in both control and ethanol-treated samples. (C) In both control and ethanol-treated samples, the endothelial cell marker cdh5/VE-cadherin was enriched in Tg(kdrl:ras-mCherry)-positive cells. Its expression was significantly lower in the Tg(hand2:EGFP)-positive cells and absent in the cells that did not express either transgene. (A-C) Triplicates were performed. The results are represented as relative expression levels that are normalized to the house keeping gene eef1a1l1 (mean±s.e.m.). (D-G'') Confocal images showing the comparison of the expression of Tg(-2.3etv2:etv2- EGFP) transgene that marks endothelial cells and their progenitors (D-G) (Schupp et al., 2014) and the expression of Tg(kdrl:ras-mCherry) that marks endothelial cells but not endothelial progenitors (D'-G'). (D''-G'') are the merged images of the two. (D-E'') show control livers at 0 hpt and (F-G'') show ethanol-injured livers at 0 hpt. (D-D'' and F-F'') are confocal three-dimensional projections. (E-E'' and (G-G'') are confocal single plane images. The expression of Tg(-2.3etv2:etv2-EGFP) completely overlapped with the expression of Tg(kdrl:ras-mCherry) in both control and ethanol-treated livers. We did not detect any hepatic cells that were positive for Tg(-2.3etv2:etv2-EGFP) expression but negative for Tg(kdrl:ras-mCherry), which would indicate that they were progenitors. Taking together, it is unlikely that the FACS-sorted HSC population is contaminated by endothelial progenitors that do not express VE-Cadherin. (D-G'') Ventral views, anterior is to the top. Scale bar, 20 μm. 10 larvae were analyzed for each experimental condition. |