
Fig. 5 S3
- ID
- ZDB-FIG-161201-37
- Publication
- Zhou et al., 2016 - BLOS2 negatively regulates Notch signaling during neural and hematopoietic stem and progenitor cell development
- Other Figures
- All Figure Page
- Back to All Figure Page
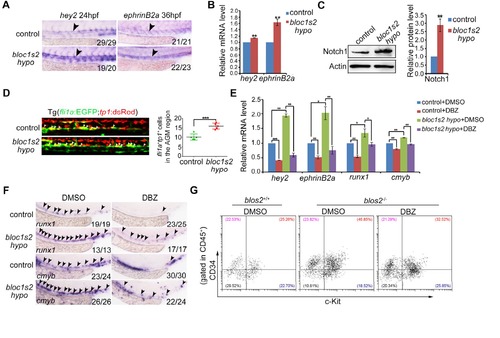
Increased Notch activity mediates the HSPC phenotype in zebrafish or mouse bloc1s2 mutants. (A) WISH results showed that the expression of Notch targets hey2 and ephrinB2a was increased in the dorsal aorta of bloc1s2 mutants. (B) qRT-PCR results from the dissected trunk region showed that expression of hey2 and ephrinB2a was significantly increased in bloc1s2 mutants. Each bar represents the mean ± s.e.m of three independent experiments. **p<0.01 (Student’s t-test). (C) Western Blot results showed that the protein level of Notch1 was increased in bloc1s2 mutants (Figure 5—figure supplement 3—source data 1). The right panel is the quantitative analysis of the western blotting results. Each bar represents the mean ± s.e.m of three independent experiments. ***p<0.001. (D) We generated bloc1s2 mutants in a Tg (fli1a:EGFP;tp1:dsRed) background. The left panels showed that the number of fli1a+tp1+ cells in bloc1s2 mutant embryos was increased. White arrowheads mark the fli1a+tp1+ cells in the AGM region at 36 hpf. The right panel is the quantification. Each bar represents the mean ± s.e.m of six embryos. **p<0.01. (E) Control and bloc1s2 mutants were treated with 4 μM DMSO or DBZ from 18 hpf to 36 hpf. qRT-PCR results from the dissected trunk region showed that the increased expression of hey2, ephrinB2a, runx1 and cmyb in bloc1s2 mutants at 36 hpf was rescued by the DBZ treatment. Each bar represents the mean ± s.e.m of three independent experiments. *p<0.05, **p<0.01, ***p<0.001. (F) WISH results showed that the increased expression of runx1 and cmyb in bloc1s2 mutants at 36 hpf was rescued by the DBZ treatment. Black arrowheads mark the expression of runx1 and cmyb in the AGM region. (G) DBZ inhibited expansion of c-Kit+CD34+ HSPCs from E11 AGM in Bloc1s2−/− mouse embryos. |
| Genes: | |
|---|---|
| Fish: | |
| Condition: | |
| Anatomical Terms: | |
| Stage Range: | Prim-5 to Prim-25 |
| Fish: | |
|---|---|
| Condition: | |
| Observed In: | |
| Stage Range: | Prim-5 to Prim-25 |