
Fig. 5
- ID
- ZDB-FIG-160926-21
- Publication
- Monteiro et al., 2016 - Transforming Growth Factor β Drives Hemogenic Endothelium Programming and the Transition to Hematopoietic Stem Cells
- Other Figures
- All Figure Page
- Back to All Figure Page
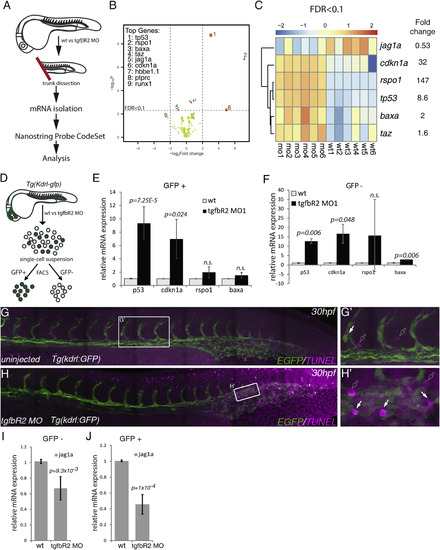
Multiplex Analysis of Gene Expression Shows that jag1a Is a Downstream Target of TGFβ Signaling (A) Schematic representation of the trunk dissection experiment for isolation of mRNA for hybridization with the NanoString Probe CodeSet. Six groups of independent wild-type (wt1-6) and tgfbR2MO1-injected embryos (mo1-6) were used in this analysis. (B) Volcano plot depicting differential gene expression between wild-type and tgfbR2 morphants in log2-fold change with a significance level of p < 0.05. Vertical broken lines limit the absolute logFC larger than 0.5-fold change range, whereas the horizontal broken line represents the false discovery rate (FDR) threshold set at FDR < 0.1. The genes where FDR < 0.1 are shown as orange dots. The size of the dots is proportional to mRNA expression levels. (C) Hierarchical clustering of genes expressed with FDR < 0.1 in each of the six biological replicates analyzed (wild-type, wt1 to wt6; tgfbR2MO1, mo1 to mo6). Results are normalized and presented as Z scores from -2 (downregulated) to 2 (upregulated). (D) Schematic representation of the sorting of kdrl:GFP+ cells in wild-type and tgfbR2 morphants (MO) by fluorescence-activated cell sorting to isolate mRNA and validate the NanoString results by qPCR. (E and F) qPCR of p53, cdkn1a, rspo1, and bax in (E) kdrl:GFP+ cells and (F) kdrl:GFP- cells of wild-type and tgfbR2 morphants (MO) at 28 hpf. Taz was omitted from the analysis as its fold induction <2. (G and G′) TUNEL-stained apoptotic cells in uninjected (control) kdrl:GFP embryos at 30 hpf. (H and H′) Apoptotic cells in tgfbR2MO1-injected kdrl:GFP embryos at 30 hpf. White arrows, apoptotic endothelial cells; outline arrows, apoptotic non-endothelial cells. (I and J) qPCR for jag1a in (I) kdrl:GFP- cells and (J) in kdrl:GFP+ cells at 28 hpf. See also Figure S5 and Table S1. |
| Genes: | |
|---|---|
| Fish: | |
| Knockdown Reagent: | |
| Anatomical Terms: | |
| Stage Range: | Prim-5 to Prim-15 |
| Fish: | |
|---|---|
| Knockdown Reagent: | |
| Observed In: | |
| Stage Range: | Prim-5 to Prim-15 |
Reprinted from Developmental Cell, 38(4), Monteiro, R., Pinheiro, P., Joseph, N., Peterkin, T., Koth, J., Repapi, E., Bonkhofer, F., Kirmizitas, A., Patient, R., Transforming Growth Factor β Drives Hemogenic Endothelium Programming and the Transition to Hematopoietic Stem Cells, 358-70, Copyright (2016) with permission from Elsevier. Full text @ Dev. Cell