
Fig. S10
- ID
- ZDB-FIG-160916-16
- Publication
- Shibata et al., 2016 - Fgf signalling controls diverse aspects of fin regeneration
- Other Figures
- All Figure Page
- Back to All Figure Page
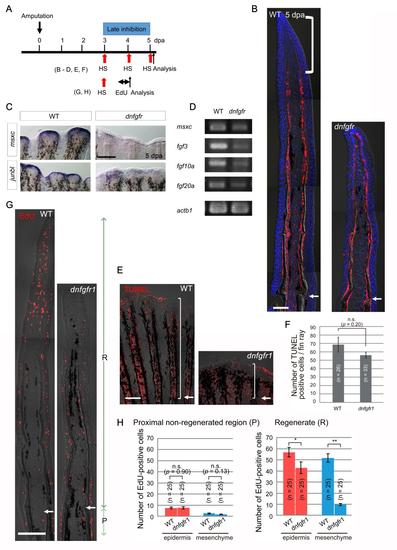
An Fgf signal at the stage after blastema formation is required for maintenance of the distal blastema and regenerative cell proliferation. (A) The experimental procedure for inhibition of the later Fgf signalling in the Tg(hsp70l:dnfgfr1). (B) Tissue sections of wild-type (WT) and Fgf-inhibited (dnfgfr) fins that were stained with the anti-Zns5 antibody. The distal Zns5-negative region, which extends approximately 200 µm from the distal tip (bracket), was retracted in the Fgf-inhibited regenerate, representing that blastema is missing. n = 5 of 5, respectively. Nuclei were counterstained with DAPI. Arrows, amputation sites. Scale bar, 50 µm. (C) Whole-mount ISH analysis of the blastema markers msxc and junbl in normal and Fgf-inhibited fins. The blastema markers are severely down-regulated in Fgf-inhibited fins (n = 6 of 6 for msxc and junbl, respectively) as compared to WT fins (n = 6 of 6 for msxc and 7 of 7 for junbl). Scale bar, 200 µm. (D) RT-PCR analysis of the expression of epidermal and blastemal fgf genes in WT and Fgf-inhibited fins. Note that the epidermal fgf20a expression was reduced as well as the blastema fgf3, fgf10a, and msxc. actb1, control PCR with β -actin1 primers. (E) The effect of later inhibition of Fgf signalling on apoptosis at 5 dpa. Cellular apoptosis was detected by the TUNEL staining. Brackets, the regenerate in which the TUNEL-positive cells were counted. Scale bar = 200 µm. (F) Quantification of the number of TUNEL-positive cells. No significant increase of apoptosis was detected by the inhibition of Fgf signalling. n, the number of fin rays used for quantification (5 WT and 4 dnfgfr1 Tg fish, respectively). n.s., not significant. (G) Cell proliferation assessed by EdU incorporation at 4 dpa in WT and Fgf-inhibited fins. EdU labelling lasted for 6 hrs before sampling. “R” indicates the regenerate distal to amputation plane, and “P” indicates the non-regenerated region within 100 µm proximal to the amputation plane. Note that Fgf-inhibition severely reduced the EdU incorporation especially in the blastema. Scale bar, 100 µm. (H) Quantification of the EdU-positive cells shown in (G). As in Fig. S1, the 3rd - 5th fin rays from the dorsal or ventral side were used for making sections. n, the total number of sections used for scoring. Five WT and 5 dnfgfr1 Tg fish were used (5 sections from each fish). Error bars represent mean ± s.e.m. Student’s t test was performed to evaluate statistical significance. n.s., not significant. *p < 0.01. **p < 0.001. |