
Fig. 2
- ID
- ZDB-FIG-160831-10
- Publication
- Xu et al., 2016 - Microglia Colonization of Developing Zebrafish Midbrain Is Promoted by Apoptotic Neuron and Lysophosphatidylcholine
- Other Figures
- All Figure Page
- Back to All Figure Page
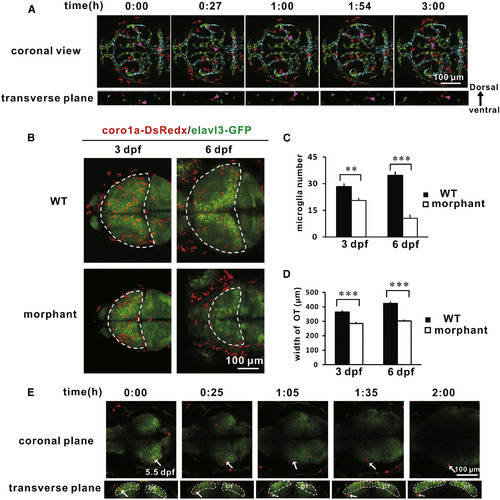
Microglia Colonization of the Optic Tectum Is Circulation Independent (A) Coronal (top) and transverse (bottom) views of time-lapse imaging pictures of the midbrain of Tg(kdrl:eGFP;coro1a:DsRedx) zebrafish embryos reveal that microglia/microglial precursors (one microglia is marked by a magenta arrowhead) are outside vessels during their colonization of the optic tectum. Red signals represent coro1a-DsRedx+ microglia/microglial precursors. Green signals represent kdrl-GFP+ vessels within the ventral midbrain, whereas cyan signals indicate vessels above the ventral midbrain. The coronal views are stacked confocal images, whereas the transverse planes are single confocal images. (B) Dorsal view of the optic tectum of Tg(-2.8elavl3:eGFP;coro1a:DsRedx) zebrafish embryos injected with or without the tnnt2a MO. The number of optic-tectum-resident microglia only slightly decreased in the 3 dpf tnnt2a morphants but is drastically reduced in the 6 dpf tnnt2a morphants. Red and green signals represent coro1a-DsRedx+ microglia and elavl3-GFP+ neurons, respectively. The optic tectum is indicated by dashed lines. (C) Quantification of the number of optic-tectum-resident microglia in WT Tg(-2.8elavl3:eGFP;coro1a:DsRedx) embryos and tnnt2a morphants. Error bars represent the mean ± SEM. **p < 0.01, ***p < 0.001 (n = 6 for both WT and morphants at 3 dpf and 6 dpf). (D) Measurement of the width of the optic tectum of WT Tg(-2.8elavl3:eGFP;coro1a:DsRedx) embryos and tnnt2a morphants. Error bars represent the mean ± SEM. ***p < 0.001 (n = 5 for 3 dpf WT, n = 6 for 6 dpf WT, n = 6 for morphants at both 3 dpf and 6 dpf). (E) Coronal (top) and transverse (bottom) views of time-lapse imaging pictures of the midbrain of Tg(-2.8elavl3:eGFP;coro1a:DsRedx) zebrafish embryos show one microglia (labeled by white arrows) migrating out of the optic tectum in the 5.5 dpf tnnt2a morphants. The optic tectum is indicated by dashed lines. Red and green signals represent coro1a-DsRedx+ microglia and elavl3-GFP+ neurons, respectively. OT, optic tectum. See also Figure S2 and Movie S2. |
| Genes: | |
|---|---|
| Fish: | |
| Knockdown Reagent: | |
| Anatomical Terms: | |
| Stage Range: | Long-pec to Day 6 |
| Fish: | |
|---|---|
| Knockdown Reagent: | |
| Observed In: | |
| Stage Range: | Protruding-mouth to Day 6 |
Reprinted from Developmental Cell, 38(2), Xu, J., Wang, T., Wu, Y., Jin, W., Wen, Z., Microglia Colonization of Developing Zebrafish Midbrain Is Promoted by Apoptotic Neuron and Lysophosphatidylcholine, 214-22, Copyright (2016) with permission from Elsevier. Full text @ Dev. Cell