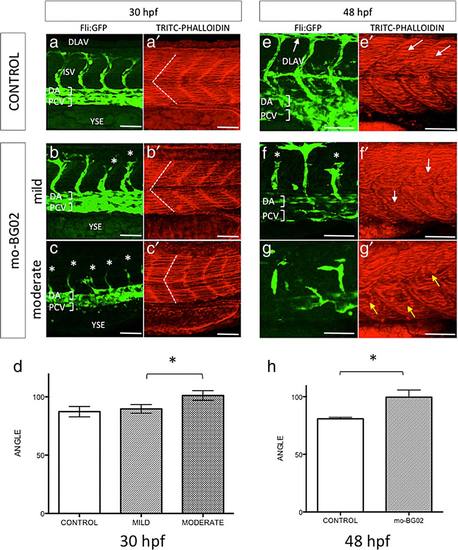
zBG morpholino knockdown effects in somite development. Lateral views of the trunk of zebrafish Tg(fi1-eGFP)y1 embryos, at the level of caudal limit of the YSE. All images correspond to maximal projections z-stack confocal images, at the indicated times and treatments. Scale bars correspond to 50 µm in all images. (a-c): GFP staining revealing ECs in control (a), mild morphants (b), and moderate morphants (c) at 30 hpf. a′-c3: TRITC-Phalloidin staining of the corresponding a-c images. White dotted lines indicates the intersomitic boundaries, and exemplifies the angles measured for each condition. (d) Quantification of morpholino effects on somite integrity at 30 hpf. Angle values and statistical analysis was done as described in materials and methods. Graph represents average ± SEM in each condition, and asterisks indicate statistical significance. Note that there is no significant difference between control (87.26 ± 1.582 N = 14 embryos) and mild morphants (89.61 ± 1.304; N = 18 embryos). (e-g): GFP staining revealing ECs at 48 hpf, corresponding to control (e), mild morphants (f), and moderate morphants (g). e′-g′: TRITC-Phalloidin staining of the corresponding e-g images. In all pictures white asterisks (*) indicate incomplete or malformed ISV. White arrows in e points to dorsal anastomotic vessels (DLAV). White arrows in e′ point to normal muscle fibers, and to abnormal curved fibers in mild morphant (f′). Yellow arrows point to regions deployed of actin-rich muscle fibers in moderate morphants (g′). (h): Quantification of morpholino effects on somite integrity at 48 hpf. Angle values and statistical analysis was done as described in materials and methods. Graph represents average ± SEM in each condition. Asterisks indicate statistical significance. At this stage, mild morphants (99.56 ± 6.209 N = 16) showed a significant increased angle respect to control (80.80 ± 1.319 N = 13, P < 0.0144).
|
