
Fig. 5
- ID
- ZDB-FIG-160726-20
- Publication
- Umeda et al., 2016 - Position- and quantity-dependent responses in zebrafish turning behavior
- Other Figures
- All Figure Page
- Back to All Figure Page
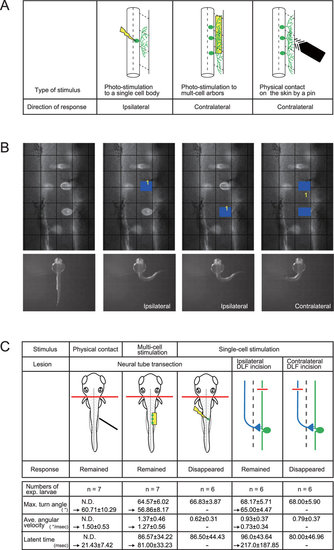
Single- and multi-cell stimulation elicit opposite lateralities by launching different neural circuits. (A) Turning direction of the first turning response. Photostimulation of a single RB neuron elicited ipsilateral turning, while photostimulation of peripheral arbors from multi-cell or touch stimulation by pin produced contralateral turning. (B) Different laterality is evoked in response to the quantity of stimulated neurons. (Upper panels) RB neurons captured from the dorsal view using a pattern-illumination device. Two neurons on the right side were targeted. Photostimulated areas are marked by blue rectangles in three images on the right. Grid intervals, 24 µm. (Lower panels) Elicited turning responses corresponding to the upper panels. Single-cell photostimulation on its cell body elicited ipsilateral turning, while the same neurons produced the contralateral response by simultaneous stimulation of both cells. Maximum turn angles, averaged angular velocities, and latent times were not significantly different between single- and two-cell stimulations (single cell, n = 12 neurons from 6 larvae, 58.33 ± 5.91°, 0.63 ± 0.52°/msec, 208.75 ± 85.13 msec; two-cell, n = 6 pairs of neurons from 6 larvae, 56.33 ± 6.98°, 0.58 ± 0.29°/msec, 251.00 ± 159.63 msec) (C) Summary of lesion experiments for the turning response. Neural tube transection at the second-somite level did not disturb the contralateral response by physical contact or multi-cell neural stimulation (left two columns), but it abolished the ipsilateral response by single-cell stimulation (middle). Incision of the contralateral, but not ipsilateral, DLF abolished the ipsilateral response (right two columns), suggesting that commissural ascending interneurons convey sensory information beyond the spinal cord to the hindbrain. Before and after the lesion operation, quantitation of the parameters of response (attached table) did not show statistical difference by Student’s t-test. |