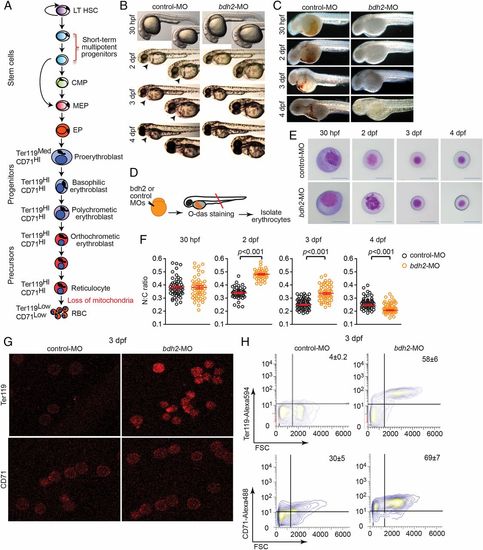
Bdh2 inactivation alters erythroid maturation. (A) Schematic depiction of vertebrate erythropoiesis. (B) Morphology of zebrafish embryos injected with control or bdh2 (to deplete the siderophore) MOs. Representative embryos at 2 dpf are shown in lateral views. Embryos are representative of at least 50 embryos per MO. Note absence of red color in bdh2 morphants. (C). Hemoglobin deficiency in bdh2 morphants is demonstrated by O-dianisidine (O-das) staining. Hemoglobin deficiency is reversed by coinjection of synthetic bdh2 mRNA. Representative embryos at 2 dpf are shown in lateral views. Embryos are representative of at least 50 embryos per MO. (D) Functional analysis of isolated erythrocytes from control or bdh2 morphants. Schematic depiction of experimental design. (E) Analysis of circulating erythrocytes from progressively aged morphants expressing control (Top) or bdh2 (Bottom) MOs. Erythrocytes from control MO-injected embryos progressively matured, whereas the immature morphology of erythrocytes persisted in bdh2 morphants. Erythrocytes are representative of the mean groups depicted in F (May-Grunwald/Giemsa stain). (Scale bars: 5 µM.) (F) The N:C ratio is a robust parameter of erythrocyte maturity during early zebrafish hematopoiesis. Scatter plots of the N:C area ratio in control or bdh2 morphants from 30 hpf to 4 dpf are shown. The N:C ratio decreased in both groups but was always greater in bdh2 morphants. Erythrocytes whose morphology was influenced by neighboring cells were excluded in N:C ratio calculations. Horizontal lines indicate mean values. Data are mean ± SD for 300 cells. P < 0.05 was considered significant. (G) Surface staining of erythrocytes isolated from control and bdh2 morphants at 3 dpf with anti-Ter119 and anti-TfR1 (CD71) antibodies. Representative images are depicted. (H) Flow cytometry analysis of erythrocytes isolated from control and bdh2 morphants at 3 dpf stained with anti-Ter119 antibody coupled to Alexa 594 or anti-CD71 antibody coupled to Alexa 488. Cell counts were calculated (mean ± SD).
|
