
- Title
-
Inactivation of 3-hydroxybutyrate dehydrogenase 2 delays zebrafish erythroid maturation by conferring premature mitophagy
- Authors
- Davuluri, G., Song, P., Liu, Z., Wald, D., Sakaguchi, T.F., Green, M.R., Devireddy, L.
- Source
- Full text @ Proc. Natl. Acad. Sci. USA
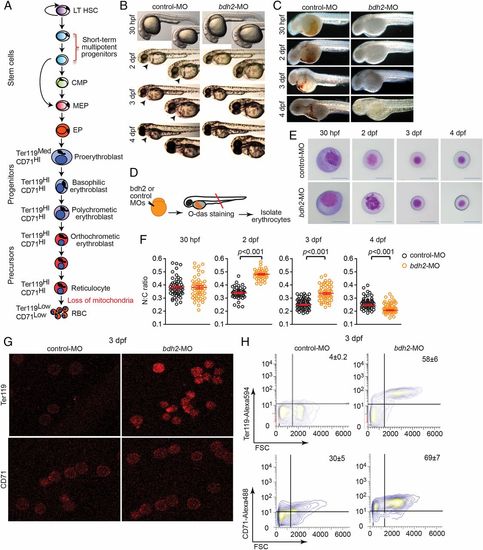
Bdh2 inactivation alters erythroid maturation. (A) Schematic depiction of vertebrate erythropoiesis. (B) Morphology of zebrafish embryos injected with control or bdh2 (to deplete the siderophore) MOs. Representative embryos at 2 dpf are shown in lateral views. Embryos are representative of at least 50 embryos per MO. Note absence of red color in bdh2 morphants. (C). Hemoglobin deficiency in bdh2 morphants is demonstrated by O-dianisidine (O-das) staining. Hemoglobin deficiency is reversed by coinjection of synthetic bdh2 mRNA. Representative embryos at 2 dpf are shown in lateral views. Embryos are representative of at least 50 embryos per MO. (D) Functional analysis of isolated erythrocytes from control or bdh2 morphants. Schematic depiction of experimental design. (E) Analysis of circulating erythrocytes from progressively aged morphants expressing control (Top) or bdh2 (Bottom) MOs. Erythrocytes from control MO-injected embryos progressively matured, whereas the immature morphology of erythrocytes persisted in bdh2 morphants. Erythrocytes are representative of the mean groups depicted in F (May-Grunwald/Giemsa stain). (Scale bars: 5 µM.) (F) The N:C ratio is a robust parameter of erythrocyte maturity during early zebrafish hematopoiesis. Scatter plots of the N:C area ratio in control or bdh2 morphants from 30 hpf to 4 dpf are shown. The N:C ratio decreased in both groups but was always greater in bdh2 morphants. Erythrocytes whose morphology was influenced by neighboring cells were excluded in N:C ratio calculations. Horizontal lines indicate mean values. Data are mean ± SD for 300 cells. P < 0.05 was considered significant. (G) Surface staining of erythrocytes isolated from control and bdh2 morphants at 3 dpf with anti-Ter119 and anti-TfR1 (CD71) antibodies. Representative images are depicted. (H) Flow cytometry analysis of erythrocytes isolated from control and bdh2 morphants at 3 dpf stained with anti-Ter119 antibody coupled to Alexa 594 or anti-CD71 antibody coupled to Alexa 488. Cell counts were calculated (mean ± SD). EXPRESSION / LABELING:
|
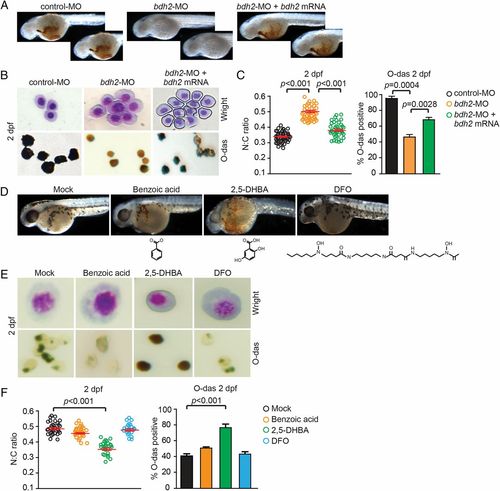
Overexpression of bdh2 or siderophore supplementation is sufficient to partially rescue hemoglobinization and erythroid maturation block in bdh2 morphants. (A) Morphological assessment of embryos injected with control or bdh2-specific MOs and bdh2-overexpressing bdh2 morphants. O-dianisidine (O-das) staining confirmed partial restoration of hemoglobinization in bdh2-overexpressing bdh2 morphants. (B) Analysis of circulating erythrocytes from embryos injected with control or bdh2-specific MOs and bdh2-overexpressing bdh2 morphants demonstrating decreased erythrocyte immaturity and partial restoration of hemoglobinization in bdh2-overexpressing bdh2 morphants. (Top) May-Grunwald/Giemsa stain. (Scale bars: 5 µM.) (Bottom) O-das staining. Erythrocytes are representative of the mean groups depicted in C. (C) (Left) The N:C ratio is an indicator of one aspect of a range of morphological features reflecting erythrocyte maturity. Tabulation of the N:C area ratio for erythrocytes isolated from embryos injected with control or bdh2-specific MOs and bdh2-overexpressing bdh2 morphants. Replenishment of bdh2 decreased the N:C ratio in bdh2 morphants. Data are mean ± SD for 300 cells. P < 0.05 was considered significant. (Right) Quantification of O-dianisidine-positive erythrocytes isolated from embryos injected with control or bdh2-specific MOs and bdh2-overexpressing bdh2 morphants. Replenishment of bdh2 restored hemoglobinization in bdh2 morphants. Data are mean ± SD for 300 cells. P < 0.05 was considered significant. (D-F) Supplementation with siderophore but not its chemical paralogs rescues hemoglobinization defect and erythrocyte maturation block in bdh2 morphants. (D) Analysis of whole of embryos. (E and F) Analysis of isolated erythrocytes. Image and data analyses are as in A-C. PHENOTYPE:
|
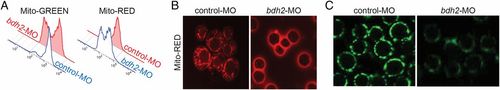
Mitochondrial clearance is increased in bdh2-inactivated erythrocytes. (A) Flow cytometry of circulating erythrocytes stained with MTR from control and bdh2 morphants. Cell counts are presented as mean ± SD (B) Confocal imaging of MTR-stained circulating erythrocytes from control and bdh2 morphants. Erythrocytes are representative of the mean groups. (C) Immunofluorescence of anti-OXPHOS complex IV subunit 1 antibody-stained circulating erythrocytes from control and bdh2 morphants. Erythrocytes are representative of the mean groups. PHENOTYPE:
|
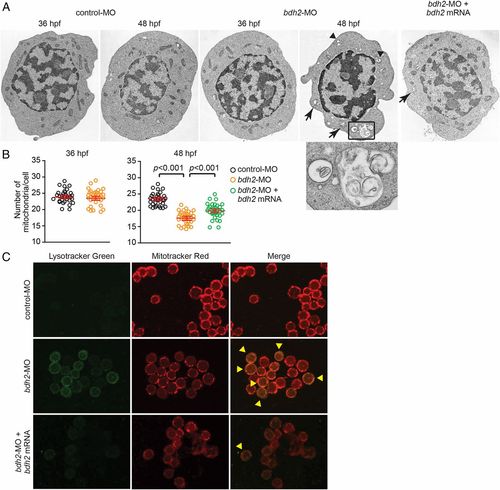
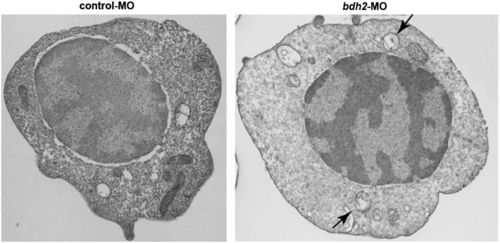
Bdh2-inactivated erythrocytes contain mitochondria in autophagosomal vesicles. (A) Representative EM images of erythrocytes isolated from control and bdh2 morphants. Arrows indicate autophagosomal vesicles. Arrowheads indicate lysosomal vesicles. (Scale bars: 1 µM.) Area in rectangle is enlarged. (Scale bar: Inset, 100 nM.) (B) Total mitochondria count per cell counted by EM. Data are mean ± SD for 50 cells. P < 0.05 was considered significant. (C) Confocal fluorescent imaging of LysoTracker- and MitoTracker-stained erythrocytes isolated from control and bdh2 morphants or bdh2-overexpressing bdh2 morphants. Arrowheads indicate costained cells. Representative images are depicted. PHENOTYPE:
|
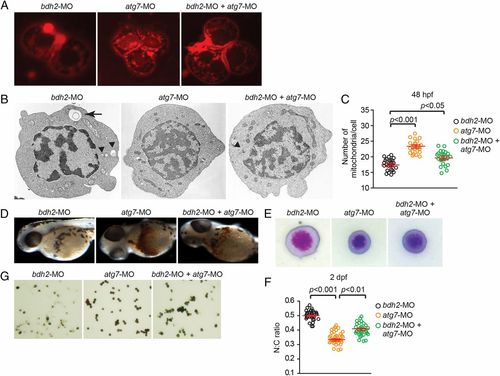
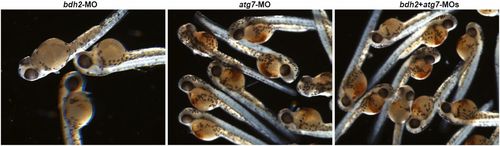
Suppression of atg7 inhibits mitophagy and rescues hemoglobinization defect in bdh2 morphants. (A) Confocal imaging of MTR-stained circulating erythrocytes from bdh2 or atg7 morphants. Erythrocytes are representative of the mean groups. (B) Representative EM images of erythrocytes isolated from bdh2 or atg7 morphants. (Scale bars: 1 µM.) (C) Total mitochondrial count per cell counted by EM. Mitochondria in autophagosomes were not included in the count. Data are mean ± SD for 50 cells. P < 0.05 was considered significant. (D) Morphological assessment of embryos injected with bdh2 or atg7 MOs. O-dianisidine (O-das) staining confirmed partial restoration of hemoglobinization in atg7-suppressed bdh2 morphants. (E–G) Analysis of circulating erythrocytes from embryos injected with bdh2 or atg7 MOs. (E) May-Grunwald/Giemsa stain (Scale bars: 5 µM.) (F) Tabulation of the N:C area ratio for erythrocytes isolated from embryos injected with bdh2 or atg7 MOs. Coinjection of atg7 MOs decreased the N:C ratio in bdh2 morphants. Data are mean ± SD for 300 cells. P < 0.05 was considered significant. (G) O-dianisidine staining confirmed partial restoration of hemoglobinization in atg7-suppressed bdh2 morphants. Erythrocytes are representative of the mean groups depicted in C. May-Grunwald/Giemsa stain. (Scale bars: 5 µM.) PHENOTYPE:
|
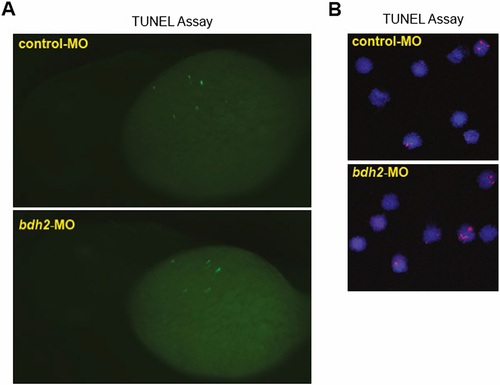
(A) TUNEL staining for apoptotic cells in control and bdh2 morphants. Control or bdh2 morphant embryos at 3 dpf were stained for apoptotic cells by using the TUNEL assay. Despite significant TUNEL staining in the nervous system, there is no excess staining of hematopoietic cells. Embryos are shown in lateral views. (B) TUNEL staining for apoptosis in erythrocytes isolated from control and bdh2 morphants at 3 dpf. Cells were counterstained with DAPI to visualize nuclei. |
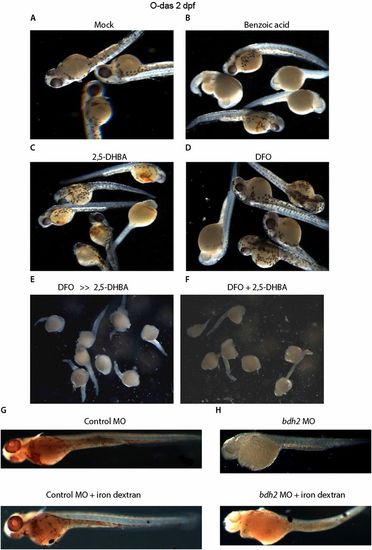
(A-F) O-dianisidine staining of bdh2 morphants supplemented with the siderophore or its chemical paralogs. Randomly selected bdh2 morphant embryos showing hypohemoglobinization. Injection of siderophore but not its chemical paralogs restored hemoglobinization. (G and H) Injection of iron dextran (100 mg/mL; Sigma) into bdh2 morphants failed to restore hemoglobinization as judged by O-dianisidine staining. |
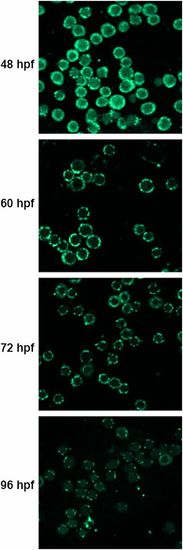
Immunofluorescence analysis of erythrocytes isolated from WT embryos at indicated times with OXPHOS subunit 1 antibody. |
Representative EM image of erythrocytes isolated from control and bdh2 morphants at 3 dpf. (Scale bars: 1 µM.) |
O-dianisidine staining of bdh2 or atg7 morphants. Randomly selected bdh2 or atg7 morphants showing hypohemoglobinization. Suppression of atg7 restored hemoglobinization. |

O-dianisidine staining of bdh2 or mfn or bdh2 and mfn morphants supplemented with the siderophore. Injection of siderophore failed to restore hemoglobinization in mfn morphants. |