
Fig. 4
- ID
- ZDB-FIG-160630-5
- Publication
- Wang et al., 2016 - Extracellular interactions and ligand degradation shape the nodal morphogen gradient
- Other Figures
- All Figure Page
- Back to All Figure Page
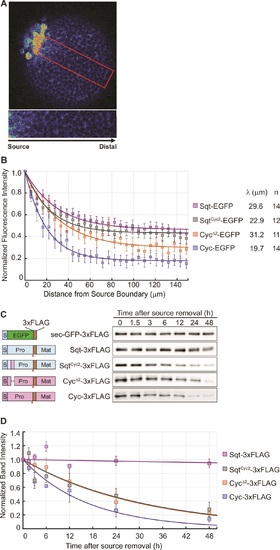
The distribution of Nodal proteins correlates with clearance. (A) Upper, representative image and region of interest (red rectangle) for measuring distribution; lower, inset showing magnified region of interest. (B) Normalized distribution profiles and fitting. Error bars indicate standard error of mean (s.e.m). (C) Representative western blots of Nodal proteins harvested from HEK293T cell culture medium at different time points after removal of the source. The Nodal proteins were immuno-precipitated with anti-FLAG antibody and detected by western blot with the same antibody. Schematics on the left show the position of the FLAG epitope tags in each construct. (D) The profile of Nodal protein levels over time after source removal. The data points were fitted with an exponential decay model. Error bars indicate s.e.m. |