
Fig. 1
- ID
- ZDB-FIG-160630-1
- Publication
- Wang et al., 2016 - Extracellular interactions and ligand degradation shape the nodal morphogen gradient
- Other Figures
- All Figure Page
- Back to All Figure Page
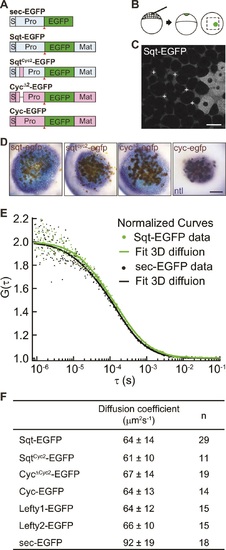
Activity range and diffusion of Nodal-GFP fusion proteins. (A) Constructs used for profiling fluorescent Nodal fusion proteins in embryos. S, signal peptide; Pro, pro-domain; Mat, mature-domain; sec-EGFP, secreted EGFP. Red arrow indicates convertase cleavage sites. (B) Injection procedure. (C) Confocal image of an injected embryo at 30% epiboly stage. White crosses mark the extracellular spots where the FCS measurements were taken. (D) Representative images of RNA in situ hybridization showing the activity range of Sqt, Cyc and mutant Nodals. Source cells are marked in brown and blue staining indicates expression of the Nodal target ntl. Scale bars, 50 µm. (E) Representative auto-correlation functions (dots) and fittings (line) of Sqt-EGFP (green) and sec-EGFP (black). (F) Table showing diffusion coefficients of the Nodal and Lefty fusion proteins as measured by FCS. |