
Fig. 8
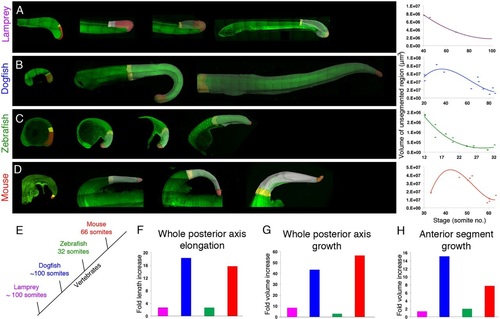
Comparative 3D morphometric analysis of posterior body elongation across vertebrates. (A-D) Maximal projections of tiled z-stacks of lamprey (A; n=7), dogfish (B; n=11), zebrafish (C; n=15) and mouse (D; n=10) embryos. All embryos were labelled with DAPI and phalloidin and are shown in lateral view with posterior to the right. Grey surface shows the segmented region, yellow the two most rostral segments of the posterior body and the red surface shows the unsegmented region. Plots of the unsegmented region volume over time (number of somites) are shown to the right for each species. (E) Simplified phylogeny for each species studied together with total somite number. (F-H) Fold change from tailbud stage until the completion of somitogenesis in length (F) and in volume (G) of the whole posterior body and fold change in volume of the two-most anterior segments (H) for each species. Purple bar, lamprey; blue, dogfish; green, zebrafish; red, mouse. |