
Fig. 3
- ID
- ZDB-FIG-160428-18
- Publication
- Jonz et al., 2016 - Sensing and surviving hypoxia in vertebrates
- Other Figures
- All Figure Page
- Back to All Figure Page
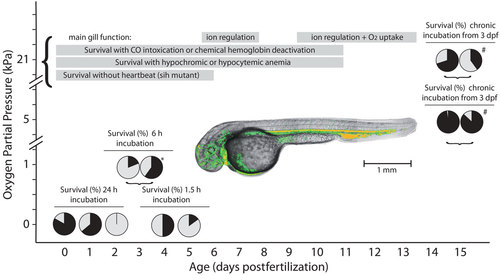
Summarized data of hypoxia/anoxia tolerance in developing zebrafish (Danio rerio) at different oxygen partial pressures. Pie charts show the percentage of survivors (black) to nonsurvivors (gray) at different ages and incubation protocols. Brackets indicate multiple data at the same time point. Horizontal bars depict survival time windows of differently affected cardiovascular convection capacities and changes of main gill function during early development. (Hypocytemic or hypochromic anemia does not affect survival during the first 10 dpf [T. Schwerte, unpublished observations]). Photograph inset shows a paralyzed (immobile) 3-day-old larva after an anoxic episode with digital motion-contrasted vessels showing functional circulation. Orange encodes a higher blood velocity (heart and dorsal artery) compared to medium velocity (green). # indicates data on mutant: breakdance (bre). * indicates data on mutant: silent heart (sih). Data were taken from Refs. 11, 78, 79, 80, 83, 84, and 86. |