
Fig. 3
- ID
- ZDB-FIG-160405-15
- Publication
- Jaffe et al., 2016 - c21orf59/kurly Controls Both Cilia Motility and Polarization
- Other Figures
- All Figure Page
- Back to All Figure Page
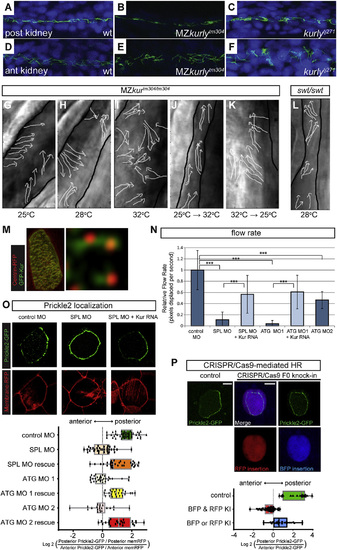
kur Mutants and Morphants Exhibit Polarity Defects in Zebrafish and Xenopus (A-F) Staining of cilia axonemes (ac-tub; green) and nuclei (Hoechst; blue) in zebrafish pronephric tubules show cilia are present, but appear disorganized and mispolarized in mutants. (G-L) Stills from live imaging of cilia. The cilia directionality is traced by the arrows in the MZkurtm304/tm304 (G-K) and the lokto237b/to237b mutants (L). The black outlines mark the edges of the tubules. The cilia in MZkurtm304/tm304 are progressively more disorganized at higher temperatures (G-I). Temperature shift experiments in kurtm304/tm304 mutants show that cilia do not become disorganized after shifting from permissive to restrictive temperatures (25°C→32°C) (J) and that cilia are able to recover their alignment defects by shifting from restrictive to permissive temperatures (32°C→25°C) (K). The swt/swt mutants exhibit dilated tubules, but normal cilia alignment (L), suggesting that tubule dilation does not cause alignment defects. (M) Cytoplasmic localization of GFP-Kur in a Xenopus MCC showing an enrichment at the basal body and rootlets (inlay). (N) Quantification of cilia generated fluid flow in control embryos and kur morphants. The average flow velocity measured by the displacement of dyed micro-beads along the skin of stage 29 Xenopus embryos is shown. The data represent three independent MOs and rescue experiments were performed with GFP-Kur RNA. The values are averages of at least ten flow lines from five embryos from two independent experiments. The error bars indicate SD and ***p value < 0.0002. (O) Representative images and quantification of Prickle2-GFP (green) and membrane-RFP (red) localization in control and kur morphants (posterior is right). The box and whisker plots represent the log2 of the posterior fluorescent intensity divided by the anterior fluorescent intensity normalized for memRFP intensity. (P) Representative images and quantification of Prickle2-GFP localization in mosaic F0 CRISPR/Cas9-edited MCCs. The control embryos were injected with Cas9 protein and homology arms without kur gRNA. RFP positive MCCs indicate integration of RFP into the short kur allele, and BFP positive MCCs indicate integration of BFP into the long kur allele. The box and whisker plot represent the log2 of the posterior Prickle2-GFP fluorescent intensity divided by the anterior fluorescent intensity. |
| Antibody: | |
|---|---|
| Fish: | |
| Anatomical Term: | |
| Stage: | Long-pec |
| Fish: | |
|---|---|
| Conditions: | |
| Observed In: | |
| Stage Range: | Long-pec to Pec-fin |