
Fig. S14
- ID
- ZDB-FIG-160316-40
- Publication
- Xu et al., 2016 - Four and a Half LIM Domains 1b (Fhl1b) Is Essential for Regulating the Liver versus Pancreas Fate Decision and for β-Cell Regeneration
- Other Figures
- All Figure Page
- Back to All Figure Page
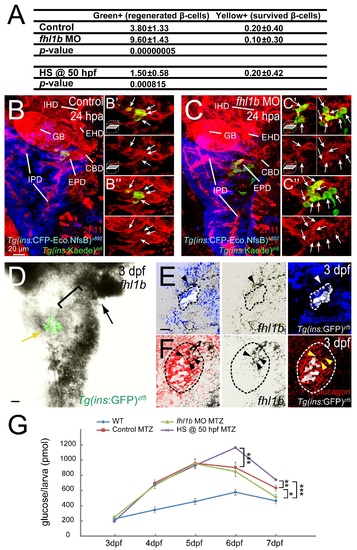
Fhl1b regulates the capacity of β-cell regeneration. (A) Quantification of the number (mean±SD) of regenerated (Green+) and survived β-cells (Yellow+; co-expressing green and red) in control, fhl1b MO-injected, and fhl1b-overexpressing (HS @ 50 hpf) larvae at 36 hours-post-ablation (hpa). Cells in 20 planes of confocal images from 10 individual larvae were counted. (B-C) Confocal images of [Tg(ins:CFP-NTR)s892; Tg(ins:Kaede)jh6] control (B-B′′) and fhl1b MO-injected (C-C′′) larvae at 24 hpa stained with 2F11 (red) and Carboxypeptidase (blue). A greater number of regenerated β-cells in fhl1b-MO injected larvae were mainly located at the junction between the pancreas and the HPD system, specifically at the EPD (C-C′′). While upper insets in B′, B′′, C′, and C′′ show the enlarged images of EPD with white arrows pointing the regenerated β-cells, lower insets in B′, B′′, C′, and C′′ only display the magnified images of EPD with white arrows. Abbreviations: GB, gallbladder; CBD, common bile duct; EHD, extrahepatic duct; EPD, extrapancreatic duct; IHD, intrahepatic duct; IPD, intrapancreatic duct. n = 10 per condition. (D) Double antibody and in situ hybridization staining of fhl1b at 3 dpf in Tg(ins:GFP)zf5 embryos. At 3 dpf, the level of fhl1b expression is high in the liver (black arrow) and in the distal intestine, low in the HPD system (black bracket), and absent in most pancreatic cells except for a few cells in the principal islet (yellow arrow). In the principal islet, fhl1b expression is confined to the peripheral boundary and does not significantly overlap with the core β-cells marked by Tg(ins:GFP)zf5 expression. n = 10. (E-F) Double antibody and in situ hybridization staining of fhl1b with Somatostatin (E) and Glucagon (F) at 3 dpf in Tg(ins:GFP)zf5 embryos. In the principal islet, fhl1b expression (black arrowheads in E and F) does not overlap with the Somatostatin-expressing δ-cells (E) but partially with a small number of Glucagon-expressing α-cells (F). Tg(ins:GFP)zf5 expression is pseudo colored as white, whereas Somatostatin (E) and Glucagon (F) expression is outlined by both white and black dotted circles. The relative position of fhl1b-expressing cells to the Somatostatin (E) and Glucagon (F) expression are indicated by white (E) and yellow (F) arrowheads. Merged views of the middle and right panels are shown in the left panels. n = 10 per condition. (G) Free-glucose levels were measured during β-cell regeneration in wild-type, MTZ-treated, MTZ/fhl1b MO-injected, and MTZ/fhl1b-overexpressing embryos/larvae. At 7 dpf, free-glucose levels were significantly lower in MTZ/fhl1b MO-injected larvae (green line, 512 pmol/larva) than MTZ-treated (red line, 633 pmol/larva) or MTZ/fhl1b-overexpressing (purple line, 742 pmol/larva) larvae. *, P < 0.05; **, P < 0.01; ***, P < 0.001. n = 30 larvae (3 pools of 10 larvae) per data point. B, B′′ and C, C′′, confocal projection images. B′ and C′, confocal single-plane images. D-F, confocal single-plane in situ hybridization images combined with the projection images of Tg(ins:GFP)zf5 (D), Somatostatin (E), and Glucagon (F) expression. Ventral views, anterior to the top. Scale bars, 20 µm. |