
FIGURE
Fig. 4
- ID
- ZDB-FIG-160311-47
- Publication
- Welker et al., 2016 - Standardized orthotopic xenografts in zebrafish reveal glioma cell line specific characteristics and tumor cell heterogeneity
- Other Figures
- All Figure Page
- Back to All Figure Page
Fig. 4
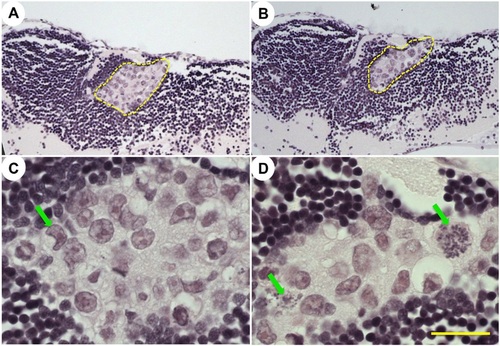
GBM9 histology staining for Hematoxalin and Eosin. (A-D) Paraffin-embedded GBM9 xenotransplanted animals at 7dpt; 40× (A,B) and 100× (C,D) magnification of two separate animals (A,C and B,D) with tumors. Yellow dashed lines in A,B denote the tumor mass. Green arrows in C,D denote hyperchromatic and abnormal nuclei. Scale bar: 50µm in A,B and 20µm in C,D. |
Expression Data
Expression Detail
Antibody Labeling
Phenotype Data
Phenotype Detail
Acknowledgments
This image is the copyrighted work of the attributed author or publisher, and
ZFIN has permission only to display this image to its users.
Additional permissions should be obtained from the applicable author or publisher of the image.
Full text @ Dis. Model. Mech.