
Fig. 3
- ID
- ZDB-FIG-160311-46
- Publication
- Welker et al., 2016 - Standardized orthotopic xenografts in zebrafish reveal glioma cell line specific characteristics and tumor cell heterogeneity
- Other Figures
- All Figure Page
- Back to All Figure Page
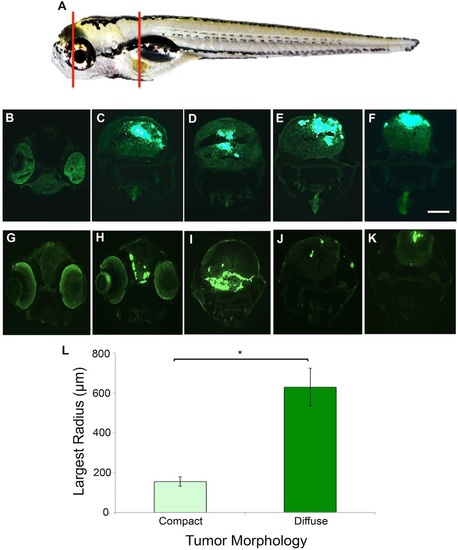
GBM9 tumor cells grow throughout the brain tissue. (A) Representative area sectioned (red lines) in a 7 dpt zebrafish. (B-F) Transverse 20-µm-thick cryosections of a GBM9 compact tumor at the level of the forebrain (B), midbrain (C,D) and hindbrain (E,F). (G-K) Transverse cryosections of a diffuse tumor at the level of the forebrain (G,H) midbrain (I) and hindbrain (J,K). (L) Based on morphology, tumors were scored as compact (light green bar) or diffuse (dark green bar) then measured by Sholl analysis at 7 dpt to quantify cell spread. Largest radius (in micrometers) is the measure of the farthest radius intersecting a cell from the injection site. n=10 per group; 20 animals total. *P<0.001. Scale bar: 100 µm for B-K. |