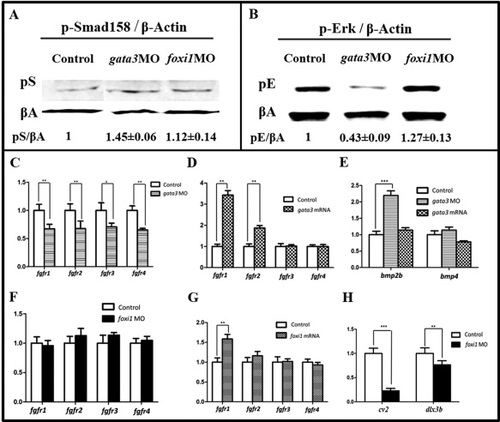
Gata3 and Foxi1 differentially regulate Fgf and Bmp signaling. A: Western blot analysis of the pSmad1/5/8 level of whole embryo (10 hpf). Both foxi1MO and gata3MO embryos show an increased p-Smad level (middle and right lanes), compared with that of control (left). The changes (mean value±error) are normalized against β-Actin level of each lane. B: Western blot analysis of p-Erk level of morphants (10 hpf). The foxi1MO embryos show an increase (middle lane) but gata3MO a decrease of p-Erk (right lane), compared with that of control (left lane). The changes (mean value±error) are normalized against β-Actin level of each lane. C: Real time-PCR tests show that in gata3 morphants, all fgfr gene expressions are down regulated at 10.5 hpf. *P < 0.05; **P < 0.01 (ANOVA test). D: Over-expressing gata3 leads to the up regulated fgfr1 and fgfr2 only. 10.5 hpf. **P < 0.01 (ANOVA test). E: Real time-PCR test shows that in gata3 morphants, only bmp2b is up regulated. 10.5 hpf. ***P < 0.001 (ANOVA test). F: Real time-PCR tests show that in foxi1 morphant, all fgfr expressions are not significantly changed. 10.5 hpf. G: Over-expressing foxi1 slightly up regulates fgfr1. **P < 0.01 (ANOVA test). 10.5 hpf. H: Real time-PCR test shows that Foxi1 regulates Bmp through cv2 and/or dlx3b. 10.5 hpf. **P < 0.01; ***P < 0.001 (ANOVA test).
|
