
Fig. 2
- ID
- ZDB-FIG-160225-19
- Publication
- Fidelin et al., 2015 - State-Dependent Modulation of Locomotion by GABAergic Spinal Sensory Neurons
- Other Figures
- All Figure Page
- Back to All Figure Page
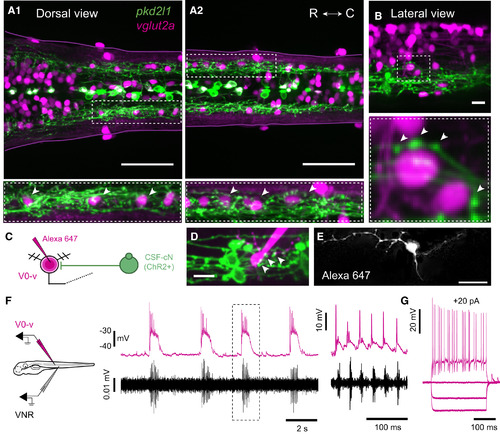
CSF-cNs Project onto V0-v Glutamatergic Interneurons (A1 and A2) Z projection stack of a few optical sections imaged from the dorsal side in Tg(pkd2l1:gal4;UAS:ChR2-YFP; vglut2a:lox-DsRed-lox-GFP) triple transgenic larvae reveal the localization of glutamatergic neurons (DsRed+, magenta) relative to CSF-cN projections (YFP+, green) in rostral (A1) and caudal (A2) spinal cord. Zoom of lateral regions circled in dashed lines show that CSF-cN projections surround the DsRed+ nucleus of ventrolateral glutamatergic interneurons (arrowheads in bottom panels, A1 and A2). See also Table S1. (B) Apposition of CSF-cN axonal varicosities onto the cell bodies of two ventrolateral vglut2a+ interneurons (arrowheads). (C) Ventrolateral vglut2a+ V0-v interneuron receiving projections from CSF-cNs were filled with Alexa 647 in order to image and reconstruct their morphology. (D) Z projection stack of a few optical sections imaged from the lateral side in a Tg(pkd2l1:gal4;UAS:ChR2-YFP;vglut2a:lox-DsRed-lox-GFP) triple transgenic larva labeling CSF-cNs (ChR2-YFP+, green) and glutamatergic interneurons (DsRed+, magenta) after dye filling a vglut2a+ V0-v interneuron. Arrowheads highlight axonal projections of CSF-cNs onto the soma and dendrites of the filled V0-v interneuron. (E) Typical morphology of ventrolateral vglut2a+ V0-v interneurons filled with Alexa 647. (F) Paired ventral nerve root recording (VNR) with whole-cell current clamp recording of a V0-v interneuron showing rhythmic activity during every episode of fictive slow locomotion (burst frequency ranged between 15 and 30 Hz). The region circled with dashed line is zoomed in on the right to emphasize the activity of V0-v during a fictive bout. V0-v action potentials preceded motor neurons spiking for all locomotor bursts. (G) V0-v cells are electronically compact, typically requiring only 10–20 pA of current injection to reach action potential (AP)-firing threshold. Note that the cell depicted in (G) is not the same cell as in (F). Scale bars are 50 µm in (A1) and (A2) and 10 µm in (B), (D), and (E). In each panel, Z projection stacks were reconstructed from a few optical sections (depth = 0.55 µm). |
| Genes: | |
|---|---|
| Fish: | |
| Anatomical Terms: | |
| Stage Range: | Protruding-mouth to Day 5 |