
Fig. S2
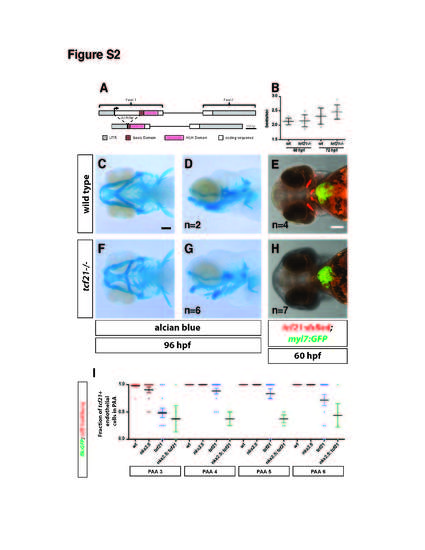
Related to Figure 4. Head cartilage forms and the overall heart morphology is not affected in the absence of tcf21. (A) Schematic representing the tcf21 genomic locus and the region deleted in the tcf21 Δ236 mutant. Scale bar is 100 bp. (B) Comparison of heart beat frequencies in wild-type and tcf21 mutant embryos at indicated stages. n = 6 for all stages and genotypes. Individual data (grey dots), mean and SD are shown. (C-H) Wild-type embryo (C-E) and tcf21 mutant embryo (F-H) at indicated stages. Alcian blue staining indicates that the head cartilage still forms in tcf21 mutant embryos (F, G) although the head size is reduced compared to wild-type embryos (C, D). The overall morphology of the heart is not affected in tcf21 mutant embryo based on myocardium-specific GFP expression (E and H). Embryos shown in E and H were fixed in 4% PFA and imaged without further staining. Scale bars are 100 µm. Ventral views (C, E, F, H) and lateral views (D, G). n indicates the number of imaged embryos. (I) Quantification of the contribution of tcf21+ cells to PAAs 3 to 6 in wild-type (includes tcf21-/+; nkx2.5-/+ and tcf21-/+; nkx2.5-/+ embryos, n=12), tcf21 mutant (includes tcf21-/-; nkx2.5-/+ embryos, n=15), nkx2.5 mutant (includes nkx2.5-/-; tcf21-/+ embryos, n=13) and tcf21; nkx2.5 double mutant embryos (n=4). Individual data points and the mean with the SEM are indicated. Note that using mCherry expressed from the tcf21 promoter is a less appropriate marker for labeling the pPAA progenitors compared to nkx2.5:ZsYellow (Figure 5Q) for two reasons. First, the perdurance of the mCherry in the pPAA progenitors is shorter leading to dimmer labeling of tcf21+ cells, especially in the anterior pPAA 3, which is likely resulting from the differentiation of the PAAs in an anterior to posterior fashion. This may result in erroneous scoring of PAAs as having less pPAA progenitor contribution than seen when using nkx2.5:ZsYellow as a pPAA progenitor marker. Second, a specific subpopulation of anterior and ventral endothelial cells in the LDA express tcf21. Therefore, compensating endothelial cells from the LDA may be scored as tcf21+ although they do not represent pPAA progenitors. This is not the case for compensating cells from the PHS, which do not express tcf21. However, as nkx:ZsYellow is not expressed in either the LDA or PHS, this is likely to account for differences seen when comparing results using tcf21:mCherry-NTR versus nkx2.5:ZsYellow as a marker for pPAA progenitors. |