
Fig. 1 S2
- ID
- ZDB-FIG-160205-33
- Publication
- Hesse et al., 2015 - The human ARF tumor suppressor senses blastema activity and suppresses epimorphic tissue regeneration
- Other Figures
- All Figure Page
- Back to All Figure Page
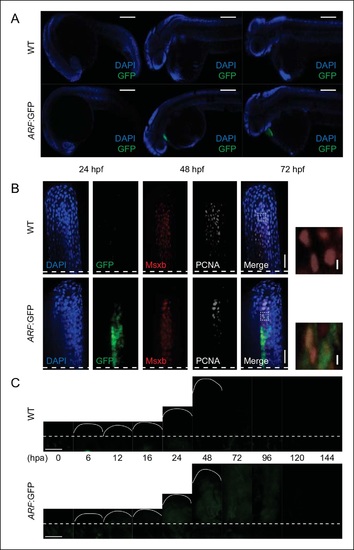
GFP reporter activity in WT or ARF:GFP zebrafish at multiple developmental and regenerative time points.(A) Immunostaining (sagittal confocal images) for GFP at 24 hpf, 48 hpf, and 72 hpf in WT and ARF:GFP embryos. Scale bars: 200 µm. GFP expression is restricted to the hearts of transgenic fish due to presence of a separate transgene used for selection (cmlc2:GFP). (B) Confocal images from Figure 1 of coronal vibratome sections immunostained for GFP, Msxb, and PCNA at 2 dpa in WT and ARF:GFP fins. Scale bars: 50 µm. Included to the right of the figure are insets showing Msxb +, PCNA +, GFP- blastema cells in WT fins and cytoplasmic GFP expression in Msxb +, PCNA + blastema cells in ARF:GFP fins (white dashed boxes). DAPI is excluded from the inset images to improve clarity of costaining. Scale bars: 10 µm. (C) Wide-field epifluorescent images of WT and ARF:GFP fins at multiple time points during fin regeneration. GFP intensity of individual ARF:GFP images was evaluated relative to that of WT images at the same time points, and the resulting values were plotted in Figure 1E. There is a small amount of detectable autofluorescence below the amputation plane in the regenerating wild-type and transgenic fins. Scale bars: 100 µm. Dashed lines represent amputation planes. GFP: Green fluorescent protein; hpa: Hours postamputation; PCNA: Proliferating cell nuclear antigen; WT: Wild type. |