
Fig. 1
- ID
- ZDB-FIG-160205-32
- Publication
- Hesse et al., 2015 - The human ARF tumor suppressor senses blastema activity and suppresses epimorphic tissue regeneration
- Other Figures
- All Figure Page
- Back to All Figure Page
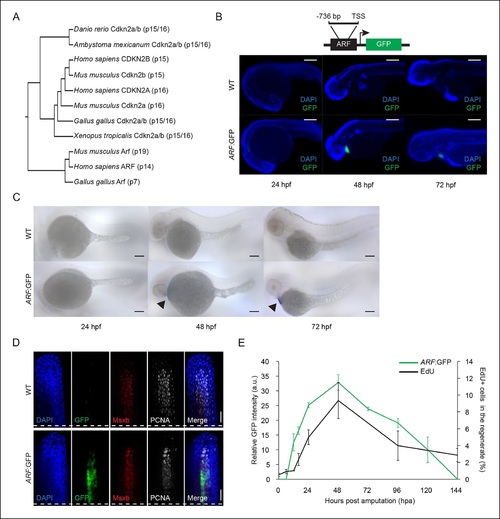
ARF, not normally present in highly regenerative vertebrates, is specifically activated in blastemas of ARF transgenic zebrafish. (A) Comparison of amino acid sequences of proteins produced by the Cdkn2a/b loci of zebrafish (Danio rerio), amphibians including the axolotl (Ambystoma mexicanum) and western clawed frog (Xenopus tropicalis), chickens (Gallus gallus), and mammals including the mouse (Mus musculus) and human (Homo sapiens). While Cdkn2a and Cdkn2b are conserved and encode Ink4 orthologs, Arf evolved recently and orthologs do not exist in highly regenerative vertebrates including teleost fish and urodele amphibians. (B) Schematic of transgene expressing cytoplasmic Green fluorescent protein (GFP) under the control of the human ARF promoter (top). The promoter consists of human regulatory sequences 736 bp upstream of the transcriptional start site (TSS) of ARF. Immunostaining (wide-field images) for GFP at 24 hpf, 48 hpf, and 72 hpf in wild type (WT) and ARF:GFP embryos (bottom). Scale bars: 200 µm. GFP expression is visible in the hearts of transgenic fish due to presence of a separate transgene used for selection (cmlc2:GFP). (C) Whole-mount in situ hybridization for GFP at 24 hpf, 48 hpf, and 72 hpf in WT and ARF:GFP embryos. Scale bars: 100 µm. Alkaline phosphatase staining is detected in the hearts of transgenic fish (arrow heads) because of the selection transgene as in (B). (D) Confocal images of coronal vibratome sections immunostained for GFP, Msxb, and Proliferating cell nuclear antigen (PCNA) at 2 dpa in WT and ARF:GFP fins. Scale bars: 50 µm. GFP expression is induced in the proliferative blastema of the regenerate, but it is not expressed in the surrounding epithelium. White dashed lines represent amputation planes. (E) GFP intensity (green line) in the regenerates of ARF:GFP transgenic fish relative to WT fish after amputation. The black line represents the percentage of EdU + cells in the regenerates of WT fish after amputation (N=3; secondary axis). Figure supplement 1 shows in vitro ARF promoter assays. Figure supplement 2 shows additional images for panels B, D, and E. Figure supplement 3 shows wound healing in WT and ARF:GFP fins. Results are shown as mean ± standard deviation. hpa: Hours post amputation. |