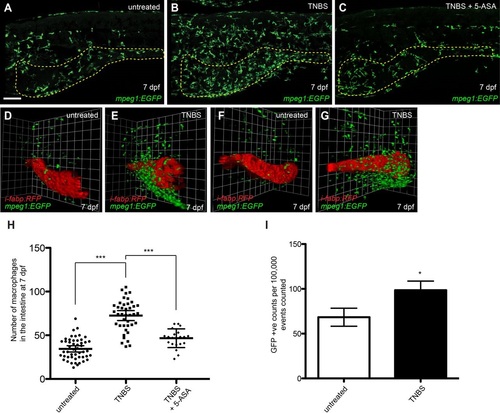
Treatment with 5-aminosalicylic acid (5-ASA) reduces TNBS-mediated macrophage recruitment to the intestine. (A-C) Lateral images of the intestine of untreated (A), TNBS-treated (B) and TNBS+5-ASA (C) mpeg1:EGFP larvae at 7dpf. The intestine is outlined with a yellow dotted line. (D-G) Three-dimensional reconstruction of the intestine in untreated (D,F) and TNBS-treated (E,G) mpeg1:EGFP;i-fabp:RFP larvae at 7dpf showing increased recruitment of mpeg1-expressing macrophage lineage cells to i-fabp-expressing intestinal epithelial cells following TNBS treatment. D,E and F,G represent two different angles taken from the same animal. (H) Quantification of macrophages in the intestine of TNBS-treated larvae compared with untreated and TNBS+5-ASA at 7dpf (ne22). (I) FACS analysis of EGFP-positive cell counts from untreated and TNBS-treated 7dpf mpeg1:EGFP larvae (ne3, each replicate contains 30-40 larvae). Error bars, ±s.d. *P<0.05, ***P<0.001, by one-way ANOVA with Dunnett′s multiple comparison test (H) or unpaired t-test (I). Scale bars: 100µm.
|
